Resale Project Scorecard
Saint Thomas Suites
D09 · Orchard, River Valley · freehold · completed 2010 · 176 units
Grade B, 5.63 out of 10, the 106th highest score among 205 resale condos in District 9.
How to read this grade. RPS is a relative comparison of seven scored factors, not a valuation, return forecast or buy recommendation.
TRIBE's 2026 back-test found the composite separated later resale returns less clearly than Historical Performance alone, so the grade should be used to open the factor details, not to close a buying decision. Read the evidence →
- Tenure
- Freehold
- Resales, 12 months to Oct 2026
- 6
- To Somerset MRT
- 290 m
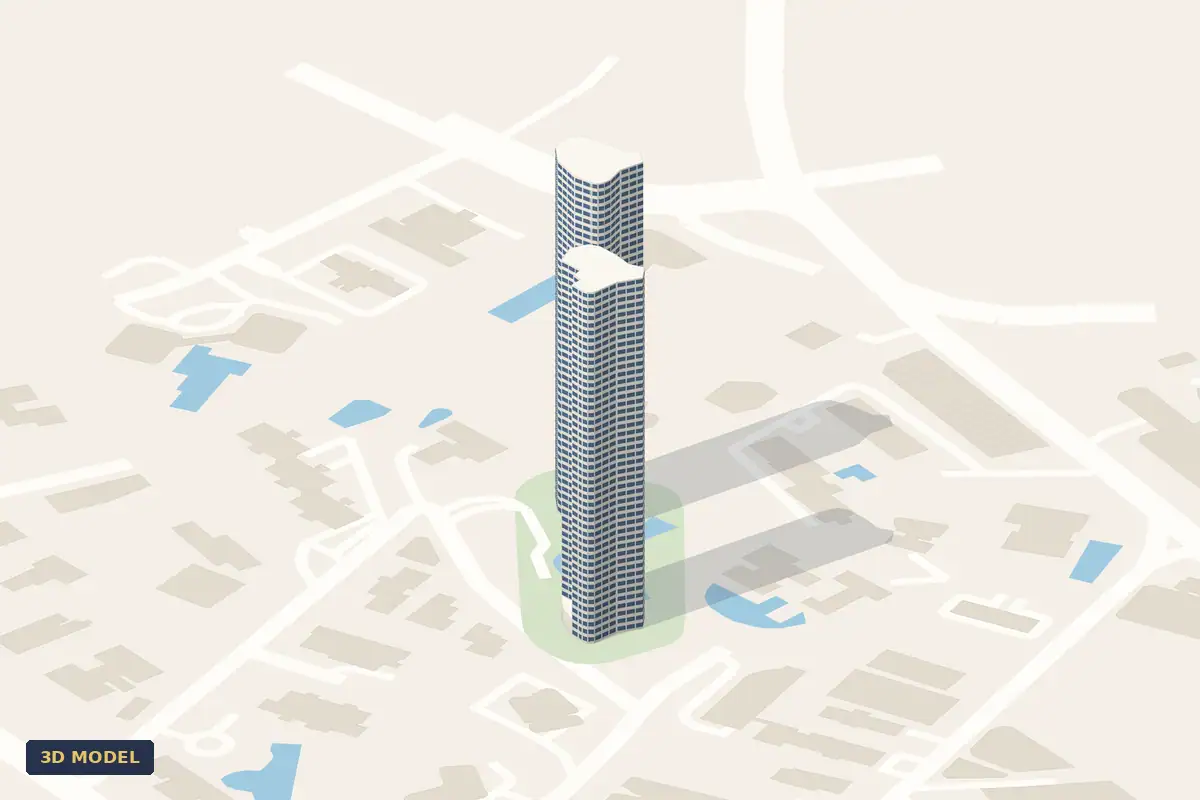
3D model: block outlines © OpenStreetMap contributors, roof heights from OneMap 3D (SLA)
Saint Thomas Suites Score
- B
- Grade
- Score out of 10
- 5.63
- Highest score among 205 resale condos in District 9
- 106th
Solid, middle-of-the-pack project. Standout strengths: tenure, MRT access. Key weaknesses: capital appreciation, rental yield.
Project's Historical Performance25%3/10
Avg Ann. of +0.91% — below-median performance vs same-vintage peers (29th percentile of 2010-era cohort).
The district median is 4/10.
Primary School Effect20%7/10
1 primary school within 1km (River Valley Primary School, 0.31km away) — a well-subscribed school. Narrow optionality, but the single option is a solid one.
The district median is 7/10.
- River Valley Primary School
Within 1km on OneMap's School Query for at least one block, the measure MOE uses for Primary 1. Check your block's postal code on OneMap School Query →
Project Size16%5/10
176 units — boutique development. Lower transaction frequency and limited shared facilities.
The district median is 3/10.
MRT Proximity13%9/10
290 m from Somerset MRT (NS23) — direct, walk-in MRT access. Strong commuter appeal.
The district median is 9/10.
Rental Yield10%3/10
Rental yield of 2.72% — below-average income return.
The district median is 3/10.
Tenure10%10/10
Freehold tenure — no lease decay concerns, preserves long-term value.
The district median is 10/10.
Future Transformation6%4/10
Limited future-catalyst exposure — nearest is Newton–Orchard mixed-use precinct at 1.64km, far enough that the impact on this project is modest.
The district median is 4/10.
Scores updated October 2026. On the map →
Why Saint Thomas Suites scores 5.63
Saint Thomas Suites scores 5.63 out of 10 on the TRIBE Resale Project Scorecard, Grade B, ranking 1514th of 2,350 resale condos scored in Singapore and 106th of 205 in District 9 (Orchard, River Valley). Its strongest factors are Tenure (10/10) and MRT Proximity (9/10); its weakest is Rental Yield (3/10).
| Factor | This condoSaint Thomas Suites | DistrictDistrict median | EffectEffect on score | Scores above |
|---|---|---|---|---|
| Project's Historical Performance25% | 3/10 | 4/10 | −0.25 | 25% of district |
| Primary School Effect20% | 7/10 | 7/10 | ±0.00 | 8% of district |
| Project Size16% | 5/10 | 3/10 | +0.32 | 62% of district |
| MRT Proximity13% | 9/10 | 9/10 | ±0.00 | 31% of district |
| Rental Yield10% | 3/10 | 3/10 | ±0.00 | 33% of district |
| Tenure10% | 10/10 | 10/10 | ±0.00 | 10% of district |
| Future Transformation6% | 4/10 | 4/10 | ±0.00 | 49% of district |
Medians are across the 205 scored resale projects in District 9 (Orchard, River Valley). “Effect on score” is the factor's weighted difference from that median, so the column sums (to within rounding) to the gap between Saint Thomas Suites and a median-profile project (5.59). “Scores above” is the share of those projects this one out-scores on the factor. Weights and bands are on the methodology page.
Saint Thomas Suites Prices
By unit type at Saint Thomas Suites
| Unit type | Size | Sold for | Median PSF | Sales |
|---|---|---|---|---|
| 3-bedroom1,819 sq ft | 1,819 sq ft | $4.42M | $2,427 psf | 2 |
| 4-bedroom2,605 sq ft | 2,605 sq ft | $5.83M to $8.80M | $2,294 psf | 4 |
Past transactions at Saint Thomas Suites
30 resales, Nov 2021 to Oct 2026 · median $2,265 psf · $3,980,000 to $16,030,000 · 28 of the 29 with a purchase on record sold at a profit
| Sale | ||||||||
|---|---|---|---|---|---|---|---|---|
| 25 Aug 2026 | 31 Saint Thomas Walk | 9 | #09-01014BR · Blk 31 | 4BR | 2,605 | $2,246 | $5,850,000 | Resale |
| 13 Aug 2026 | 33 Saint Thomas Walk | 14 | #14-06064BR · Blk 33 | 4BR | 2,605 | $2,342 | $6,100,888 | Resale |
| 12 Jun 2026 | 33 Saint Thomas Walk | 16 | #16-06064BR · Blk 33 | 4BR | 2,605 | $2,236 | $5,825,000 | Resale |
| 6 Apr 2026 | 33 Saint Thomas Walk | 29 | #29-04044BR · Blk 33 | 4BR | 3,757 | $2,343 | $8,800,000 | Resale |
| 23 Jan 2026 | 33 Saint Thomas Walk | 13 | #13-05053BR · Blk 33 | 3BR | 1,819 | $2,534 | $4,610,000 | Resale |
| 10 Nov 2025 | 33 Saint Thomas Walk | 2 | #02-05053BR · Blk 33 | 3BR | 1,819 | $2,320 | $4,220,000 | Resale |
| 17 Oct 2025 | 31 Saint Thomas Walk | 21 | #21-01014BR · Blk 31 | 4BR | 2,605 | $2,323 | $6,050,000 | Resale |
| 10 Oct 2025 | 31 Saint Thomas Walk | 14 | #14-02024BR · Blk 31 | 4BR | 2,013 | $2,434 | $4,900,000 | Resale |
| 3 Oct 2025 | 33 Saint Thomas Walk | 24 | #24-06064BR · Blk 33 | 4BR | 2,605 | $2,265 | $5,900,000 | Resale |
| 22 Sep 2025 | 31 Saint Thomas Walk | 10 | #10-01014BR · Blk 31 | 4BR | 2,605 | $2,207 | $5,750,000 | Resale |
Show as a table
| Period | Sales | Median PSF | D9 |
|---|---|---|---|
| Nov 2021 – Jan 2022 | 2 | $2,210 psf | $2,153 psf |
| Feb–Apr 2022 | 3 | $2,150 psf | $2,140 psf |
| May–Jul 2022 | 2 | $2,192 psf | $2,074 psf |
| Aug–Oct 2022 | — | — | $2,184 psf |
| Nov 2022 – Jan 2023 | 2 | $2,411 psf | $2,193 psf |
| Feb–Apr 2023 | 1 | — | $2,192 psf |
| May–Jul 2023 | 1 | — | $2,138 psf |
| Aug–Oct 2023 | 1 | — | $2,198 psf |
| Nov 2023 – Jan 2024 | — | — | $2,280 psf |
| Feb–Apr 2024 | 1 | — | $2,165 psf |
| May–Jul 2024 | — | — | $2,228 psf |
| Aug–Oct 2024 | 1 | — | $2,238 psf |
| Nov 2024 – Jan 2025 | 2 | $2,314 psf | $2,301 psf |
| Feb–Apr 2025 | 2 | $2,228 psf | $2,305 psf |
| May–Jul 2025 | — | — | $2,306 psf |
| Aug–Oct 2025 | 6 | $2,284 psf | $2,265 psf |
| Nov 2025 – Jan 2026 | 2 | $2,427 psf | $2,331 psf |
| Feb–Apr 2026 | 1 | — | $2,420 psf |
| May–Jul 2026 | 1 | — | $2,395 psf |
| Aug–Oct 2026 | 2 | $2,294 psf | $2,245 psf |
A quarter is plotted from two sales up; the district line from ten.
Sellers here made a median +1.1% a year, ranked 29 of 48 in D09 and 630 of 715 condos. See the most profitable condos in D09 →
URA REALIS resale and sub-sale caveats, Nov 2021 to Oct 2026. Check one unit →
Saint Thomas Suites Rent
- Median rent a month
- $9,930 to $13,000
- Gross yield
- 2.6% to 2.7%
- Rental contracts
- 52
| Unit type | Median rent | Most rents | Gross yield | LetsContracts |
|---|---|---|---|---|
| 3-bedroom | $9,930 | $9,500 to $10,000 | 2.7% | 22 |
| 4-bedroom | $13,000 | $11,500 to $15,450 | 2.6% | 30 |
Rental contracts at Saint Thomas Suites
52 contracts, Sep 2025 to Aug 2026 · median $11,150 a month · $9,000 to $20,000
| Month | Type | Size | Rent a month |
|---|---|---|---|
| Aug 2026 | 3BR | 1,800 to 1,900 sq ft | $9,500 |
| Aug 2026 | 4BR | 2,000 to 2,100 sq ft | $10,000 |
| Aug 2026 | 4BR | 2,000 to 2,100 sq ft | $11,000 |
| Aug 2026 | 4BR | 2,000 to 2,100 sq ft | $11,200 |
| Aug 2026 | 4BR | 2,000 to 2,100 sq ft | $11,800 |
| Aug 2026 | 4BR | 2,600 to 2,700 sq ft | $16,000 |
| Jul 2026 | 3BR | 1,800 to 1,900 sq ft | $9,500 |
| Jul 2026 | 4BR | 2,000 to 2,100 sq ft | $11,500 |
| Jul 2026 | 4BR | 2,000 to 2,100 sq ft | $11,800 |
| Jul 2026 | 4BR | 2,600 to 2,700 sq ft | $14,900 |
URA rental contracts. The table above is the 12 months to August 2026. Yield is gross. URA publishes no unit number for a letting.
Saint Thomas Suites By stack
- Highest, stack 02
- $2,400 psf
- Lowest, stack 01
- $2,207 psf
- Stacks with 2+ resales
- 5
| Stack | Median PSF | Size | Sold on | Sales |
|---|---|---|---|---|
| 01 | $2,207 psf | 2,605 sq ft | Levels 2 to 22 | 7 |
| 02 | $2,400 psf | 2,013 sq ft | Levels 14 to 27 | 3 |
| 04 | $2,356 psf | 3,757 sq ft | Levels 28 to 31 | 4 |
| 05 | $2,281 psf | 1,819 sq ft | Levels 2 to 33 | 7 |
| 06 | $2,236 psf | 2,605 sq ft | Levels 4 to 28 | 7 |
URA REALIS resale caveats, 2022 to Oct 2026. Sun path by facing →
Saint Thomas Suites Notes
How these numbers are worked out
- Grade B places Saint Thomas Suites in a relative band under the current seven-factor formula. RPS is a relative comparison of seven scored factors, not a valuation, return forecast or buy recommendation. TRIBE's 2026 back-test found the composite separated later resale returns less clearly than Historical Performance alone, so the grade should be used to open the factor details, not to close a buying decision. Two units can still be very different buys: the asking price, stack, floor, facing and condition decide the outcome.
- PSF against the district: $2,331 psf at Saint Thomas Suites against $2,356 psf across District 9, medians over 12 months.
- MRT distance is a straight line on the map; the walking route is longer.
- Prices: aggregates of URA REALIS resale caveats, data to October 2026 (Nov 2025 – Oct 2026; the year before is Nov 2024 – Oct 2025, median $2,284 psf). A specific unit's value depends on floor, size, facing and condition.
- By unit type: a price range is shown from three sales up; with two, the figure is the median.
- Past transactions: every resale and sub-sale caveat lodged with URA from Nov 2021 to Oct 2026, newest first; a unit is its storey and stack (#07-18). Typing a unit or a stack lists its sales across the whole span. Profit is the sale price less the seller's own purchase price as the caveats pair them, before stamp duties, fees and loan interest; the gain a year is compounded and shown from one year held. The trend line is the median from two sales up per month, quarter or half-year, the district line from ten. 10Y appears once the dataset runs that far back.
- Rent: aggregates of URA rental contracts, Sep 2025 – Aug 2026, for unit types with three contracts or more; the contract list under the table carries every letting on file, including those with no bedroom count, and URA publishes no unit number for a letting. "Most rents" is the middle half of contracts, shown from five up. Gross yield is a year of the median rent over the median resale price of the same unit type (12 months to October 2026, two sales or more), before maintenance fees, property tax, agent fees, vacancy and mortgage interest.
- By stack: resales from 2022 to Oct 2026, medians per stack. A stack is the last two digits of the unit number, so #05-37 and #08-37 are both stack 37. Stacks with one sale (1 here) are left out, and prices moved over the period, so read a gap between two stacks as a lead to check, not a rule.
- Factor bars: the black mark on each bar is the district median.
- Score: seven weighted factors. Methodology published.
What the score cannot tell you
- RPS scores the project, not a unit. Floor, stack, facing, renovation and the asking price are outside the score. In the 12 months to October 2026, the 6 resale caveats at Saint Thomas Suites ranged from $2,236 psf to $2,534 psf: that spread is unit-level variation the score cannot see.
- Historical Performance is a percentile among projects of similar vintage (completed around 2010, within a year or so, widened when the cohort is small). A high score is strong for its age group, not against the whole market.
- The nearest MRT is Somerset MRT (NS23), 290 m in a straight line. The walking route is usually longer, and bus links are not scored.
- Primary School Effect counts the one primary school within 1 km on OneMap's School Query (the school's land boundary to the block's building outline, the measure MOE uses for P1), weighted by recent P1 ballot demand. A school counts when any block is within 1 km, so confirm your own block's postal code before relying on it.
- Scores updated October 2026; transactions to October 2026. Nothing on this page is a valuation or advice on a specific unit.
- Facing decides a unit's morning or afternoon sun, and it varies stack by stack. See the sun path at Saint Thomas Suites for any facing, date and time → The hours count direction only; the 3D map draws the shadows of the blocks around it.