Insights
A Launch Sold Before Completion Earns Half a Point a Year More
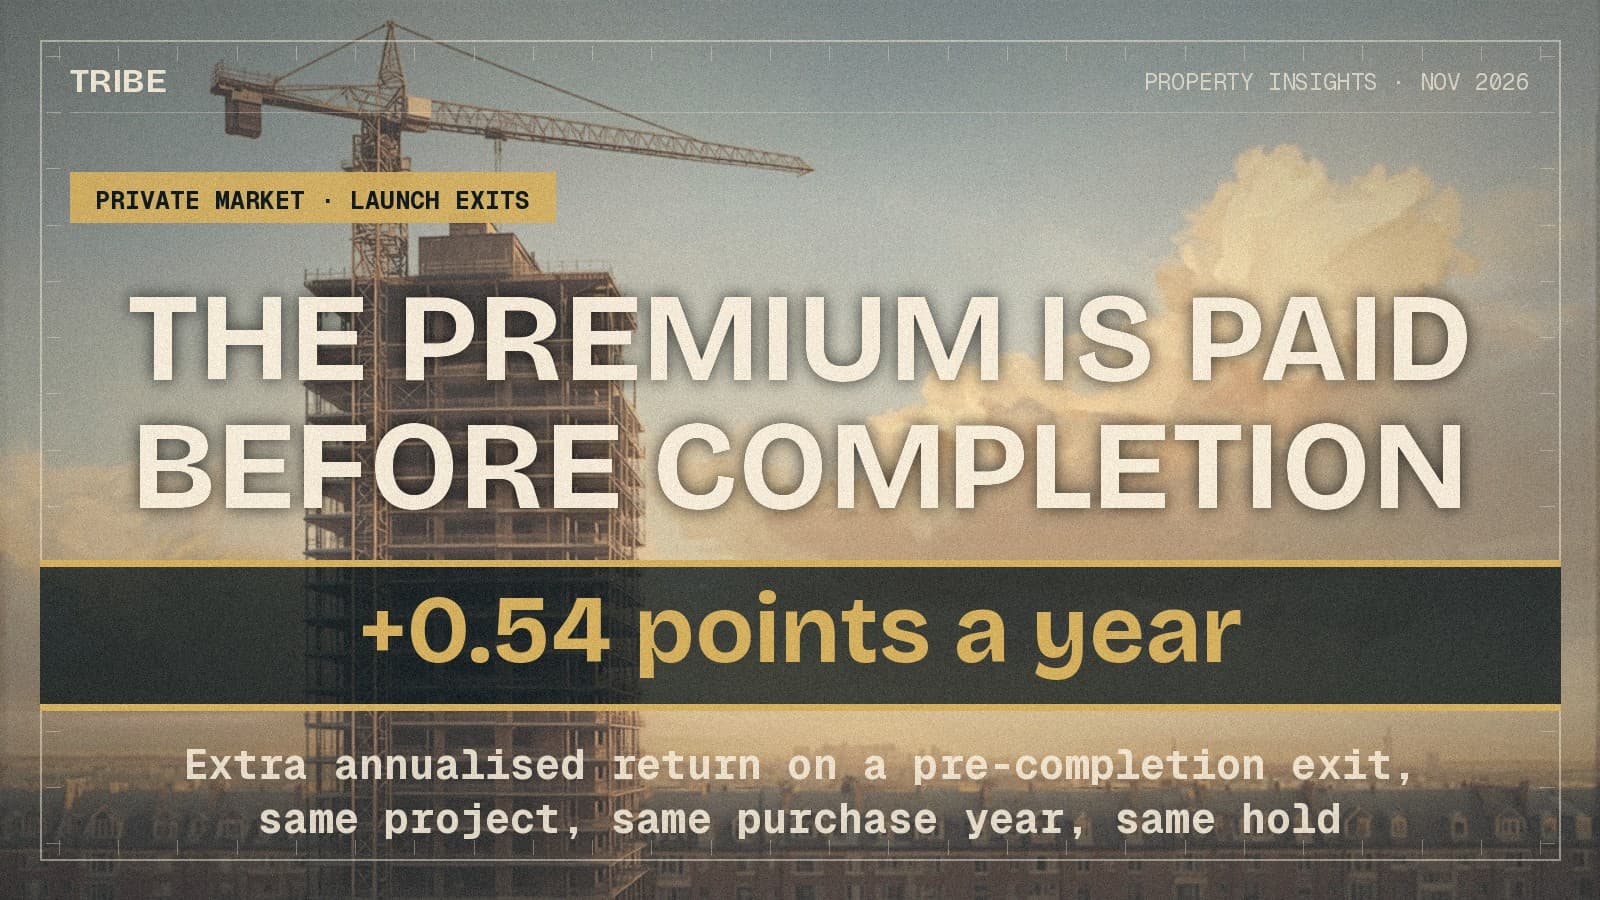
Across 823 same-unit sales of private condos bought from developers, selling before completion earned 0.54 percentage points a year more than selling the same unit as resale afterwards, comparing units in the same project bought in the same year and held equally long. The edge fades by the fifth year.
By TRIBE Research · 1 November 2026 · 10 min read
The decision
- Who this is for
- Owners who bought a private condo from a developer and are weighing a sale before the project completes.
- The question
- Does selling before completion get me a better outcome than waiting for the keys?
- The short answer
- Comparing the same units, in the same project, bought in the same year and held for the same time, a sale before completion earned 0.54 percentage points a year more than a resale afterwards. On a $2,000,000 purchase held four years that is about $47,600. Before costs, 5.0% of pre-completion exits sold below the launch price against 14.7% of post-completion ones.
- Next step
- Send us your project, the price you paid the developer and the year you are thinking of selling, and we will model both exit routes on your own numbers.
The numbers behind it
- +0.54 points a yearExtra annualised return on a pre-completion exit, same project, same purchase year, same length of hold
- 5.0% against 14.7%Share of exits that sold below the developer price before costs, pre-completion against post-completion
- 1.035 timesSub-sale price per square foot against the developer's own price in the same project at the same time
Every buyer who signs for a condo under construction eventually faces the same fork. The project is two or three years from completion, the price list has moved up, and the unit can be assigned to someone else now as a sub-sale, or kept to completion and sold later as ordinary resale stock. The decision is usually argued on tax and on sentiment. It is almost never argued on what the two routes have actually paid.
Across 823 same-unit sales of private condominiums bought directly from developers, the pre-completion exit won. Pooled, it returned a median 4.10% a year against 2.99% for the same decision taken after completion. Once the comparison is held to the same project, the same purchase year and the same length of hold, the advantage shrinks but does not vanish: 0.54 percentage points a year, with a t-statistic of 2.18. And it decays with every year held, to almost nothing by the fifth.
The question a launch buyer actually faces
The two routes are not two markets for the same thing. A sub-sale is the assignment of an uncompleted unit: the buyer takes over a building contract, usually funded on progressive payments, and the comparable sitting next to it is the developer's own live price list. A post-completion resale is an ordinary secondhand home, and its comparable is every other secondhand home in the district.
So the question is not simply "will prices be higher later". It is whether the unit is worth more while it is still being sold as new.
The answer
It is. Taking 504 launch-to-sub-sale pairs and 319 launch-to-resale pairs of the same physical units across 104 projects, the pre-completion exit earned more per year of ownership, and did so in every purchase-year group in the data. It also lost money far less often. The size of the edge is modest and it is strongest early, which matters more than the direction for anyone deciding today.
What the two routes returned
| Pre-completion exit | Post-completion resale | |
|---|---|---|
| Same-unit pairs | 504 | 319 |
| Median holding period | 3.54 years | 3.84 years |
| Median total gain | +14.8% | +12.1% |
| Median annualised return | 4.10% | 2.99% |
| Sold below the launch price, before costs | 5.0% (25) | 14.7% (47) |
| Sold below it after stamp duties | 11.3% (57) | 25.7% (82) |
Those are medians of individual same-unit returns, and they are price-to-price: the price paid to the developer against the price received. The last two rows add Buyer's Stamp Duty on the purchase and Seller's Stamp Duty where the holding period triggered it, and nothing else.
The loss rows are the ones worth sitting with. A launch unit sold before completion fell below its own purchase price once in twenty. Held to completion and sold afterwards, it fell below once in seven, and once in four after duties.
Why the raw comparison cannot be trusted
Three things are wrong with reading the table as a verdict.
A post-completion resale is by definition a later sale, so the two columns are selling into different markets. The pre-completion column includes sales from 2022; the post-completion column cannot start until a project tops out and in practice starts in 2024.
The holding periods differ, and holding longer lowers an annualised return mechanically. In this sample each extra year of ownership costs 0.63 percentage points a year, which is the same direction we found when we looked at holding periods directly.
And the sellers are not the same people. Within a project, pre-completion sellers had bought at the 24.4th percentile of the purchase order against the 50.0th for post-completion sellers. They bought earlier in the launch.
The controlled comparison
Each of those three is testable, and the finding survives all three.
Compared inside the same project, among the 25 projects where units left by both routes, the pre-completion exit returned more in 16 of 25, by a median of 0.62 percentage points a year.
Compared inside the same purchase year, the edge appears in 3 of 3 groups and is remarkably stable: +1.04 points for 2021 buyers, +1.08 for 2022, +1.10 for 2023. Compared inside the same year of sale, it appears in 2 of 3, at +1.12 in 2025 and +1.02 in 2026, with 2024 a tie on 34 pairs.
Put all of it in one regression — annualised return on an exit-route indicator, with project fixed effects, purchase-year fixed effects and the holding period as a control — and the pre-completion exit is worth +0.54 percentage points a year (standard error 0.249, t = 2.18, 823 pairs, 104 projects). That is the number the headline carries, because it is the one that answers the decision.
The earlier buying is real, but it is not the explanation. Pre-completion sellers bought earlier in the sequence and yet paid the same share of their project's price range as everyone else: the 50.0th percentile of launch price on both sides. They bought sooner, not cheaper.
Where the edge comes from, and where it disappears
The mechanism is visible in the prices themselves. For 319 sub-sales with at least three developer sales in the same project within 120 days, the sub-sale transacted at a median 1.035 times the developer's own price per square foot, and above it 64% of the time. The sub-seller is not competing with secondhand stock. They are competing with the showflat, and pricing just over it.
That advantage is a function of the project still being new, so it fades as the newness does. Split by holding period, the gap runs +5.07 points a year under three years, +0.92 between three and four, and +0.26 between four and five. By the time a unit has been held five years there is nothing left to capture.
It is also not universal. On 99-year stock the gap is +1.26 points a year. On freehold stock it reverses, to −0.48 points, on 62 pre-completion and 100 post-completion pairs. Freehold buyers are not paying for newness in the same way. By region the edge is widest in the RCR (+1.12) and OCR (+0.99) and thinnest in the CCR (+0.75).
One cost that does not explain any of this is Seller's Stamp Duty. Only 6.0% of pre-completion exits and 5.0% of post-completion ones fell inside the SSD window at all. Median holds of 3.5 and 3.8 years sit just past the three-year window that applied to almost every purchase here. Sellers are already timing around it.
What this does not prove
It does not prove that selling early is the better decision for a given owner. A 0.54-point annual edge on a $2,000,000 purchase held four years is about $47,600 at exit, before agent commission and legal fees, which can absorb a good part of it. Rent collected after completion, financing costs, maintenance and property tax are all outside these figures, and a completed unit can be let while an uncompleted one cannot.
It does not prove causation. Owners who exit before completion may differ from those who hold in ways no caveat records: cash position, intent at purchase, or a view on the project that turned out to be right.
The sample is realised sales only. A unit bought at launch and still held today contributes nothing to either column, and if the units that never sold are the weaker ones, both columns are flattered.
Only 25 projects offered both exit routes, holding periods cluster between three and four years, and there are no observations past five years. The standard errors are conventional, not clustered by project, so the t-statistic should be read as indicative. A pattern across four years of a rising market is not a law.
What it means if you are holding a launch unit
If you bought a leasehold launch in the RCR or OCR in the last three or four years and you were going to sell soon anyway, the data says the window while the developer is still selling is the stronger one, and that it closes as the project completes. The honest framing is that a pre-completion sale is paid for newness, and newness is the one asset in a condo that only depreciates.
If you bought freehold, the argument does not apply to you, and the evidence here mildly favours waiting.
If you are holding for ten years, none of this should move you. The edge is a timing effect inside the first five years, and it is dwarfed by the purchase-year effect that decides most launch outcomes.
Your next step
The figures above are medians across 104 projects. Your own answer depends on the price you paid, your outstanding loan, your stamp-duty position and the year you would sell. Send us the project, the price you paid the developer and the year you are considering, and we will put both exit routes against your own numbers in the Exit Strategy Forecast.
Method
Transaction records from TRIBE's caveat dataset as committed to the repository, covering 117,319 caveats across 2,325 private condominium projects and running through 4 October 2026, each carrying bedroom count, contract date, price, price per square foot, floor area, floor, stack, tenure and transaction type. Transaction types are new sale (a purchase from the developer), sub sale (the assignment of an uncompleted unit) and resale (a completed secondhand home).
Same-unit pairs are built by matching consecutive transactions on project, floor and stack, requiring floor areas within 3% to guard against a stack label repeating across blocks. That yields 6,541 pairs overall, of which 504 are new sale to sub sale and 319 are new sale to resale: purchases from 11 October 2021 to 26 July 2026, sales from 12 September 2022 to 2 October 2026.
Returns are computed per pair from price to price and annualised over the exact number of days held. All group figures are medians of individual pair returns, never a return computed between two group medians, which is a different statistic.
Buyer's Stamp Duty is applied on the purchase from the residential marginal tiers in force since 15 February 2023. Seller's Stamp Duty is applied on the sale using the schedule selected by acquisition date and the band selected by holding period, with a disposal exactly on an anniversary falling into the lower band: the three-year 12/8/4 schedule for acquisitions from 11 March 2017 to 3 July 2025, and the four-year 16/12/8/4 schedule from 4 July 2025.
No other cost is included anywhere above: not agent commission, legal fees, mortgage interest, maintenance, property tax or rent received, and no figure is adjusted for CPF.
The regression is ordinary least squares of the annualised return on an exit-route indicator, the holding period in years, purchase-year fixed effects and project fixed effects, over the 823 pairs with a recorded purchase price per square foot and floor area. Standard errors are conventional and not clustered. Cell comparisons require at least five pairs on each side to be reported.
The mechanism test compares each sub-sale's price per square foot to the median of the developer's own new sales in the same project within 120 days, and is restricted to the 319 sub-sales with at least three such sales. Only aggregates are reported, and nothing here is a view on any individual project.
Sample: 823 same-unit repeat sales of private condominiums bought from developers across 104 projects, 504 sold before completion and 319 after, with purchases from 11 October 2021 to 26 July 2026 and sales from 12 September 2022 to 2 October 2026, drawn from TRIBE's caveat dataset as at 4 October 2026. Figures are price to price and annualised; they include Buyer's Stamp Duty and Seller's Stamp Duty only where the text says so, and exclude agent commission, legal fees, mortgage interest, maintenance, property tax and rent received. General information, not financial advice.
Your next step
Bought from a developer in the last four years and weighing an exit before the keys? Send the project, the price you paid and the year you are considering, and we will model both routes on your numbers.
A consultant replies on WhatsApp. No registration, no obligation.
Prefer a personal read on your situation? Arrange a consultation →Keep reading

31 October 2026Private Property Market
The School Catchment Is in the Price. It Is Not in the Tenants.
30 October 2026Private Property Market
We Audited All Seven Factors. The Score They Add Up To Is Weaker Than One of Them.

29 October 2026Private Property Market
Our Project Size Factor Promises Resale Turnover. In Freehold Stock It Runs Backwards.
Next step
TRIBE Research
Written with AI assistance from TRIBE's own data and the public sources listed, then checked against them. General information, not financial advice. How we write
Data as of 4 October 2026.
How TRIBE scores and checks its analysis
Spotted an error, or a figure that has moved since publication? Tell us and we will correct it.
General information only, not financial, investment, legal or tax advice. It does not consider your own circumstances; check your own numbers before you commit.