
Insights
The School Catchment Is in the Price. It Is Not in the Tenants.
TRIBE's scorecard gives primary-school catchments 20% of the weight and calls it appeal to families. Across 227,418 lettings, the mix of homes let near schools is explained by what the project was built with, not by the catchment.
By TRIBE Research · 31 October 2026 · 9 min read
The Primary School Effect on TRIBE's resale scorecard carries 20% of the published weight, the second-heaviest of seven factors. Its own explanatory text tells you what it believes it is measuring. On a project marked 10 it reads: "Exceptional school catchment — strong appeal for families with young children."
Appeal to families is a claim about demand, and demand is testable. Last week we showed that buyers do pay for the catchment once you compare inside a district. This piece asks the question a step further down: do the families actually turn up?
Across 227,418 rental contracts signed over the three years to August 2026, the answer is that they do not turn up in any way the data can see. The rent premium near schools is a coin flip once you compare homes of the same size in the same district — high-scoring projects beat low-scoring ones in 39 of 71 cells. The mix of homes let near a school is explained almost entirely by what the developer built there, with a coefficient of 0.954 on the project's own stock mix and nothing left over for the catchment. The factor predicts prices. It does not predict tenants.
What the factor is, and what it costs
The mark runs from 1 to 10 and at 20% weight it moves a project's final score by up to 1.8 points — wider than any grade band on the board. 388 of 2,350 scored condos carry a 1 or a 2; 842 carry a 9 or a 10. There is very little in between, as we noted last week: the factor is close to binary in practice.
For the rental test, 2,187 of the 2,350 scored condos matched the rental file by name, and 1,845 of them had at least ten lettings to work with. Those 1,845 projects supply 241,255 contracts, 227,418 of which carry a usable rent and floor area. Throughout, "high" means a school mark of 8 to 10 and "low" means 3 or below.
First, the part that works
Buyers agree with the factor. Taking each project's average sale psf over the trailing two years and comparing bands inside the same district, high-scoring projects trade at a median 5.45% premium, and they are dearer in 12 of 17 districts with enough projects on both sides. That is a smaller gap than the 8.4% the tighter caveat-level cut produced last week, but it points the same way.
Rents are higher too, at project level, and by a similar order. Which is the first clue about what is going on: if prices and rents both rise about the same amount, the catchment is not changing the income case for the asset at all. Gross yield — median rent psf annualised over average sale psf — is flat. High-scoring projects beat low-scoring ones in 10 of 17 districts, by a mean of 0.005 percentage points. That is nothing, measured twice.
The rent premium does not survive a bedroom control
The project-level rent comparison has the same defect as the pooled price comparison: a project's rent psf depends heavily on how big its units are, because small units let for far more per square foot than large ones. Hold bedroom count still as well as district, comparing contracts rather than project averages, and the premium goes away.
| Test | Cells | High rent psf above low | Mean gap |
|---|---|---|---|
| District × bedroom, all | 71 | 39 | +0.063 psf |
| District × bedroom, excluding ECs | 69 | 38 | — |
| 3-bedroom and larger only | 33 | 19 | −0.022 psf |
39 of 71 is 55%. On the family-sized homes the factor is specifically about, the mean gap is slightly negative. There is no premium here to find.
Nor is there extra traffic. Lettings per 100 units per year — the closest thing this data has to tenant demand — correlates with the school mark at −0.133 pooled, and at −0.004 once each district is demeaned. Pooled, projects near schools let slightly less often; within a district, nothing at all.
The family test, and the honest version of its result
Rent levels and letting counts are indirect. The direct test of "appeal to families with young children" is composition: of the homes actually let in a project, what share are family-sized — three bedrooms or more?
The raw gradient runs backwards. High-scoring projects let 38.9% family-sized homes against 42.9% for low-scoring ones. But that comparison is close to meaningless on its own, because a project can only let what it contains, and the three bands differ in both unit mix and location.
| School mark | Projects | Median rent psf | Lettings per 100 units/yr | Family-sized share of lettings |
|---|---|---|---|---|
| Low (1–3) | 452 | 4.39 | 24.9 | 42.9% |
| Mid (4–7) | 544 | 4.71 | 26.7 | 51.6% |
| High (8–10) | 849 | 4.40 | 21.9 | 38.9% |
So the test has to hold the project's own stock mix still. Regressing each project's family-sized share of lettings on its family-sized share of sale transactions, with district fixed effects, across 1,062 projects in 27 districts:
- The stock-mix coefficient is +0.954, with a t-statistic of 69.4. What a project lets is what a project is.
- The high-catchment indicator is −1.56 percentage points, with a t-statistic of −1.42.
That second number is the result, and it needs stating carefully, because it is not the headline a critic would want. −1.42 is not significant. The sign is negative in every cut we ran — −1.67 points excluding executive condominiums, −1.10 in freehold stock, −1.35 in leasehold — and it reaches significance only on the 861 projects with 30 or more lettings, at −2.63 points and t = −2.52. We are not claiming the catchment repels families. We are reporting that after the stock mix has taken 0.954 of the variation, there is no room left for a 20% factor to do anything, and what little is left leans the wrong way.
The one measure pointing its way
Rent growth. Comparing median rent psf in the last twelve months of the window against the first twelve, high-scoring projects grew faster in 11 of 17 districts, by a median 0.66 percentage points. That is the single result in this piece that goes the factor's way, and 11 of 17 is not far from a coin flip either. We publish it because it is there.
Two condos, two schools, seven marks apart
One structural note, since it affects how much any of this costs a reader. The mark is not a function of the count and the distance printed beneath it.
Park East in D15 has two primary schools within a kilometre, the nearer of them 70 metres away. It is marked 3. Kovan Grandeur in D19 also has two primary schools within a kilometre, the nearer one 220 metres away — three times further — and is marked 10. The difference is Primary 1 ballot demand, which the factor weights and the sentence under the mark does not mention. Park East's text says "Moderate school access"; Kovan Grandeur's says "Exceptional school catchment".
That is a documented input, not a defect. But seven marks is 1.4 points of final score, and grades on this board are assigned by rank into a fixed 10/20/40/20/10 split, so the catchment line is not just expensive in isolation — every condo it lifts pushes a different condo down a band.
How to read it
If you are buying a home and schools matter to your household, the catchment is worth what it is worth to you, and the market broadly agrees: you will pay a few percent more inside a district for it.
If you are buying the same home as an investment, the school line should not enter the decision. You pay the premium at purchase, the rental market returns it at roughly the same rate, the yield comes out level, and the tenant mix does not change. Three years of contracts show no catchment effect on what tenants pay per square foot, how often units let, or who lets them.
And the factor's own label oversells it. "Strong appeal for families with young children" is a demand claim. On the evidence here it is a price claim wearing demand's clothes.
Method
Rental contracts from TRIBE's rental file as committed to the repository on 30 October 2026, covering 254,329 contracts across 2,359 projects for the 36 months from September 2023 to August 2026, each carrying bedroom count, month, monthly rent and floor area. Scorecard marks and rationale text from rps-data-v2.json as published at tribesg.com/rps-data-v2.json, 2,350 condos. Sale psf and unit mix from the project file; sale psf is each project's two-year average where the file carries one, which covers 1,674 of the 1,823 projects in the yield comparison, and its all-time average for the remaining 149. Unit mix is the bedroom distribution of recorded sale transactions and is a proxy for stock composition, not a developer unit schedule. Published factor weights reproduce each printed score to within 0.03, which is the rounding of integer factor marks.
Projects are matched between files by normalised name on a canonical token set; 2,187 of 2,350 match and 1,845 clear a ten-letting floor. Rent psf is monthly rent divided by floor area. Cell comparisons report medians and require at least 20 contracts per side for contract-level tests and at least three projects per side for project-level tests. The regression is ordinary least squares with district fixed effects and no weighting; standard errors are conventional, not clustered, so the t-statistics should be read as indicative. Every figure above was recomputed from source in a 56-assertion check before publication.
Rent growth compares the first and last twelve months of the window and so includes whatever the market did over that period; it is not adjusted for lease renewals, furnishing or unit turnover. Lettings per unit is a turnover measure, not an occupancy measure: a project of investor-held small units lets more often than an owner-occupied project of the same size, regardless of schools. Only aggregates are reported. Nothing here is a view on any individual project, and the scorecard's published weights are unchanged by it.
Condos in this article

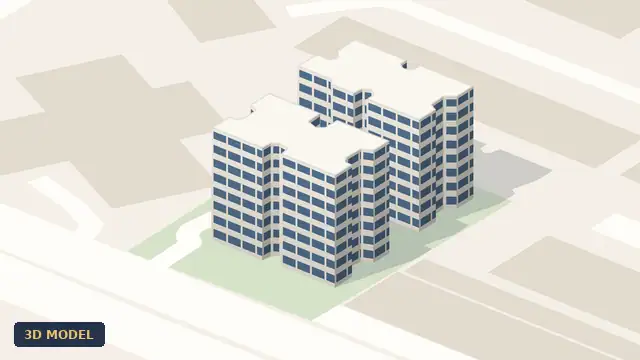
Check how your condo scores
2,350 condos independently scored across 7 weighted factors. No registration required.
Score my resale →Prefer a personal read on your situation? Arrange a consultation →Keep reading
30 October 2026Private Property Market
We Audited All Seven Factors. The Score They Add Up To Is Weaker Than One of Them.

29 October 2026Private Property Market
Our Project Size Factor Promises Resale Turnover. In Freehold Stock It Runs Backwards.
26 October 2026Private Property Market
Our Heaviest Factor Does Predict the Future. It Has One Working Threshold, Not Ten.
Next step
TRIBE Research
Written with AI assistance from TRIBE's own data and the public sources listed, then checked against them. General information, not financial advice. How we write
How TRIBE scores and checks its analysis
Spotted an error, or a figure that has moved since publication? Tell us and we will correct it.
General information only, not financial, investment, legal or tax advice. It does not consider your own circumstances; check your own numbers before you commit.