Insights
Our Heaviest Factor Does Predict the Future. It Has One Working Threshold, Not Ten.
Project's Historical Performance is 25% of every score on TRIBE's resale scorecard. Across 6,115 same-unit resales bought since 2021, its top band earned a real 1.51 points a year more. Scores three through eight are indistinguishable from each other.
By TRIBE Research · 26 October 2026 · 7 min read
Project's Historical Performance is the heaviest factor on TRIBE's resale scorecard — 25% of every score, more than schools, more than MRT, more than tenure. It is also backward-looking by construction, which invites the obvious objection: past performance is not indicative of future results.
We tested it. Across 6,115 same-unit resales bought in 2021 or later, the factor does predict forward return, and by a margin worth money. Projects scoring 9 or 10 out-earned everything below them in 25 of 25 district-and-vintage cells, by a median of 1.51 percentage points a year.
The rest of the scale does nothing. A project scoring 7 beat a project scoring 4 in thirteen cells out of twenty-four — a coin toss. We publish a ten-point factor with one usable cut in it.
The number it states is accurate
The factor writes its own claim into every scorecard in plain text: "Avg Ann. of +8.21% places this condo in the top 3% of its 2018-era cohort." That is checkable, so we checked it, the same way we checked the Rental Yield factor yesterday.
Every caveat in TRIBE's resale dataset carries the seller's own purchase price and date, which turns 68,581 of 117,319 transactions into matched repeat sales of the same unit — an annualised capital return with no index and no hedonic model. On the 1,381 projects with at least five such pairs and a stated figure, the published number and the observed one agree: rank correlation +0.894, a median absolute gap of 0.53 points, and 80.4% of projects inside one point.
The one systematic flaw is a conservative bias. Observed return came in above the stated figure for 83.0% of projects, by a median of 0.47 points — and almost exactly that much in every band, from +0.40 at the bottom to +0.47 at the top. The factor understates growth evenly, so it does not distort the ranking. It is measuring the thing on its label.
Before you control for anything, it looks superb
Sort forward return by the factor's score band and the gradient is almost too good:
| Factor score | Forward pairs | Annualised return |
|---|---|---|
| 0–2 | 299 | 3.54% |
| 3–4 | 1,114 | 4.27% |
| 5–6 | 1,262 | 3.97% |
| 7–8 | 1,587 | 4.85% |
| 9–10 | 1,853 | 6.80% |
A 3.3-point spread from bottom to top, on returns earned entirely after the window the score was built from. Most of it is location.
The bottom band is 53% Core Central Region and the top band is 1%. Over this period the CCR returned 2.68% a year against 5.98% in the Outside Central Region, so a factor correlated with region will inherit that gap whether or not it knows anything. Hold the region still and the gradient stops being a gradient:
| Factor score | OCR return | RCR return |
|---|---|---|
| 0–2 | 7.07% | 4.40% |
| 3–4 | 5.14% | 4.10% |
| 5–6 | 4.69% | 3.72% |
| 7–8 | 5.34% | 4.12% |
| 9–10 | 7.43% | 5.62% |
Inside a region the relationship is a U, not a slope. In the OCR the lowest band is the second-best performer on the board.
One threshold
So we tested each cut on the scale separately, inside cells of the same district and the same purchase year — which holds location, vintage and the market the buyer bought into all still at once.
| Comparison | Cells | Higher band wins | Median gap |
|---|---|---|---|
| 9–10 vs 0–8 | 25 | 25 | +1.51 pts |
| 7–8 vs 3–6 | 24 | 13 | +0.12 pts |
| 5–6 vs 3–4 | 17 | 9 | +0.13 pts |
The top cut is as clean a result as this dataset produces: twenty-five cells, twenty-five wins, no exceptions. The other two cuts are noise. Drop the vintage control and the 7–8 band's advantage over 3–6 turns negative, −0.01 points across nineteen districts.
Pooled, the bottom band returns 3.54%, the middle of the scale 4.41% and the top band 6.80%. Scores three through eight carry 3,963 of our 6,115 forward pairs — roughly two-thirds of the transacting market — and the factor cannot tell them apart. On the median 2021 purchase of $1,290,000, the top band's controlled edge is worth about $119,000 over five years. The difference between a 4 and a 7 is worth nothing.
Part of the top band is an executive condo
Twenty-seven percent of the forward pairs in the 9–10 band belong to executive condominiums, and they are not performing like the rest of it: 8.32% a year against 6.18% for the non-EC remainder. Thirty of the 185 projects in the top band are ECs by name — Treasure Crest, Hundred Palms Residences, Sol Acres, Bellewaters and others — mostly TOP 2017 to 2019, which puts their minimum occupation periods unwinding squarely inside this window. TRIBE's board carries no EC flag, so the cluster is invisible unless you look for it.
Strip the ECs out and the headline survives, smaller: the top band still wins 20 of 20 district-and-vintage cells, by 1.05 points instead of 1.51. Freehold-only, where no EC is possible, the top band returns 6.54% against 2.90% at the bottom. The threshold is real. About a third of its apparent size is a policy artefact.
132 projects are scored on a figure nobody measured
Five projects on the board say so plainly: "Insufficient resale data over the 10-year window to evaluate secondary market performance." That is the honest answer. Another 132 — 5.6% of everything we score — get a different one. Their factor states "Avg Ann. of +0.00%" and then reads a percentile off it: "below-median performance vs same-vintage peers (22th percentile of 2023-era cohort)."
Nothing was measured. Forty-eight percent of those projects reached TOP in 2020 or later, so the ten-year resale window has little or nothing in it, and a 0.00% that means no data is being scored as a 0.00% that means no growth. All 132 land between 1 and 5 on a factor worth a quarter of the total.
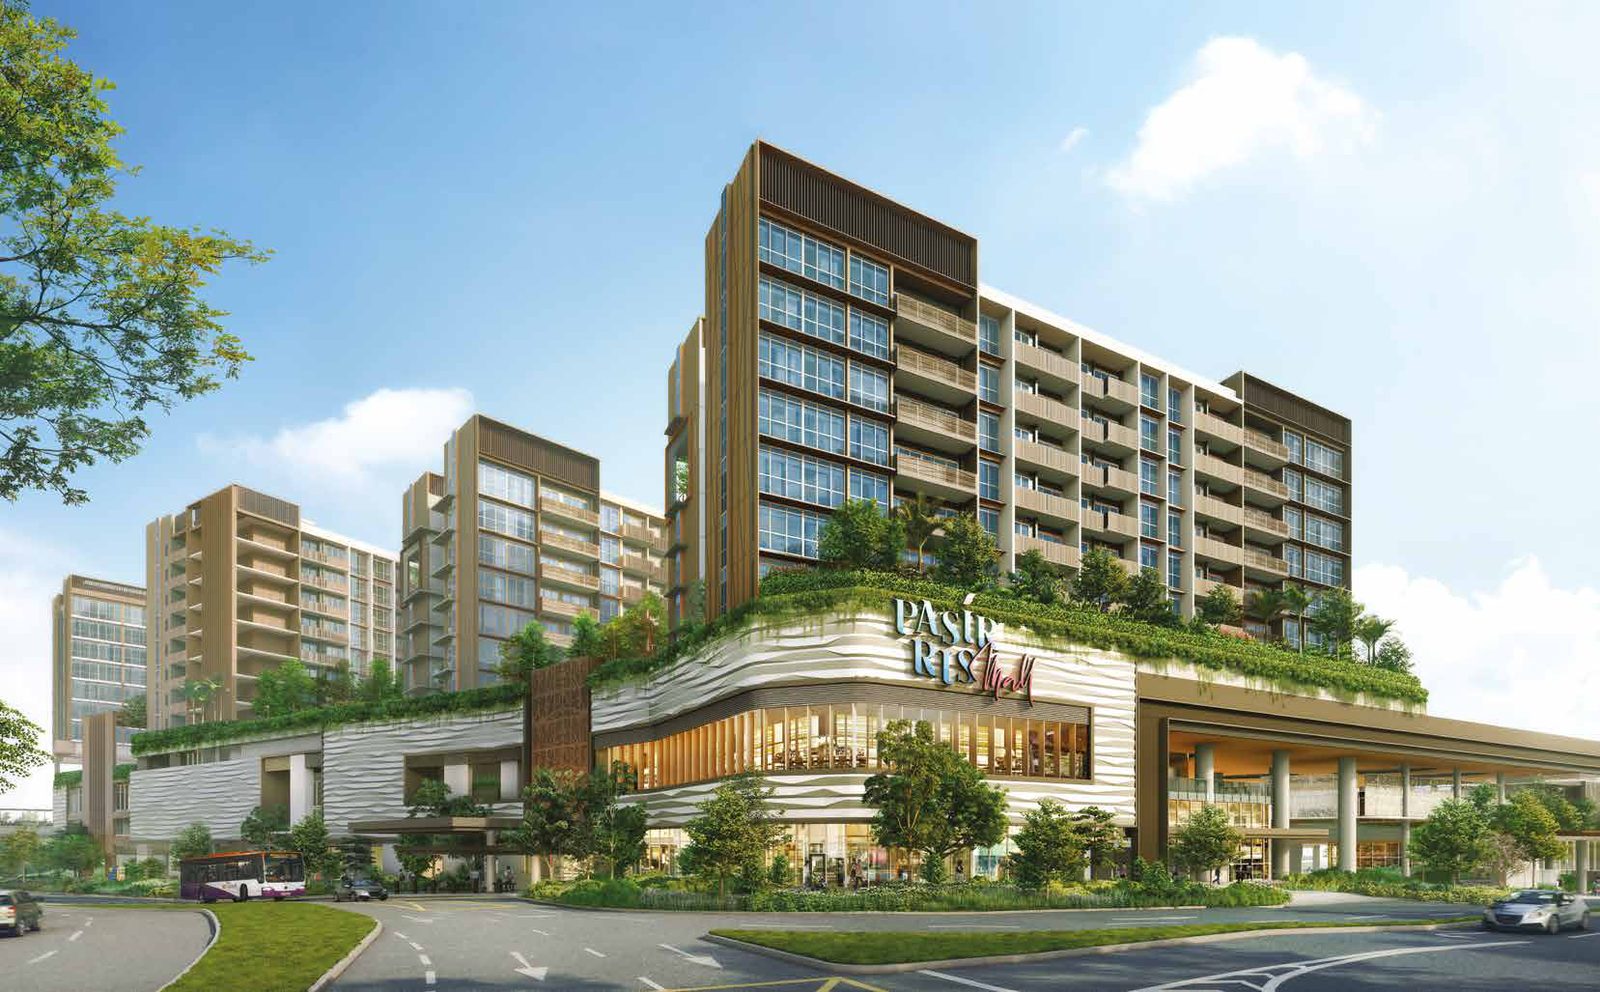
Where enough has since transacted to check, several are performing well: Sengkang Grand Residences at 4.10% across 149 pairs, Pasir Ris 8 at 5.84% across 59, AMO Residence at 5.46% across 42, The Watergardens at Canberra at 4.25% across 77. Each is scored 3 or 4. The cohort as a whole returned 4.27% against 5.02% for the board — below average, but nowhere near the bottom-quintile placement the text asserts. Excluding all 132 leaves the main result untouched, at +1.73 points pooled.
This is the second scoring defect we have found that comes from an absence of data rather than a measurement: 103 projects score 1 on the school factor because their address failed to geocode. Both deserve the same treatment the five honest ones get — no score, and a line saying why.
What this is worth, and what it is not
Three limits, stated plainly. A repeat-sale return is only measured on units that sold, and owners sitting on losses tend not to sell, so every figure here is a floor. Project-level persistence is weak even where the bands separate — correlating a project's pre-2023 return against its post-2022 return gives just +0.378, so the top band is a sorting tool across groups, not a promise about one building. And a forward window that starts in 2021 is one market cycle, measured over a median hold of 3.67 years.
What survives all of it: a 9 or a 10 on this factor has been worth about a point a year, everywhere we can control for, and the eight points below it have been worth nothing. A factor with one working threshold should be scored as one, and we are looking at whether this one should be collapsed. We would rather publish that than a decimal we cannot defend.
General information only, not financial or property advice. Figures are computed from TRIBE's resale caveat and scorecard datasets as at 26 October 2026 and will move as new transactions are lodged. Confirm policy details with HDB, URA, IRAS or MAS as applicable.
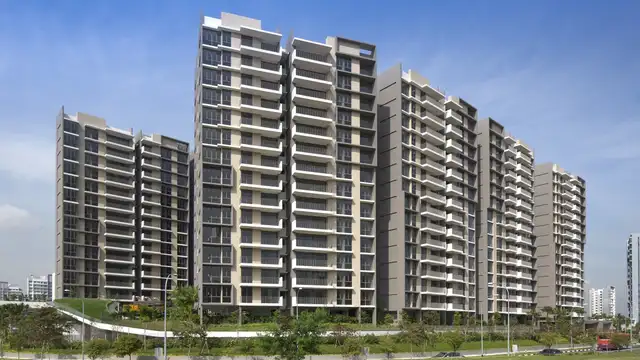
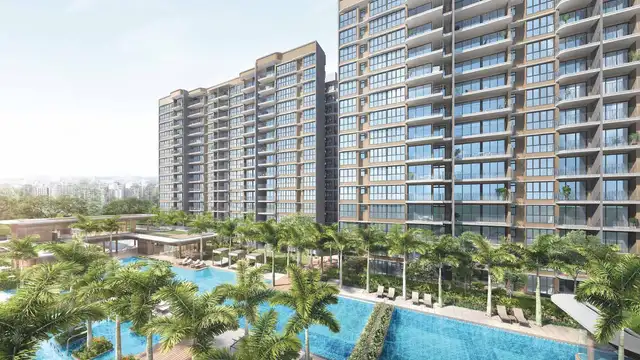
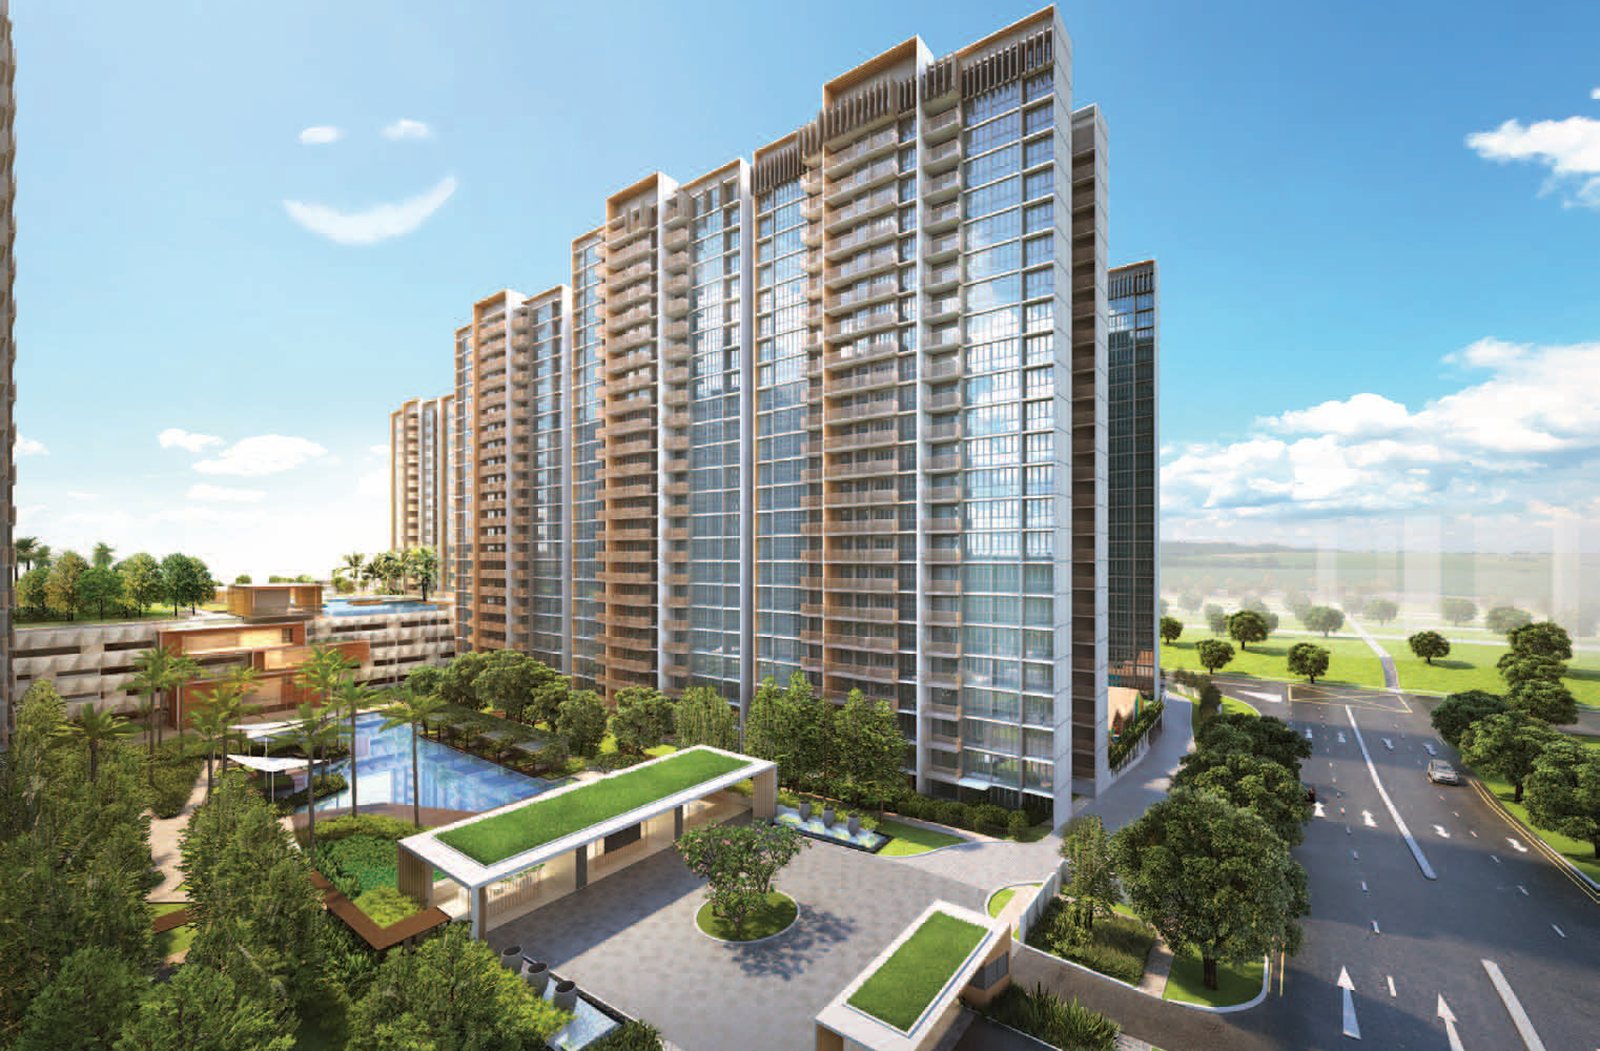
Condos in this article


Check how your condo scores
2,350 condos independently scored across 7 weighted factors. No registration required.
Score my resale →Prefer a personal read on your situation? Arrange a consultation →Keep reading
25 October 2026Private Property Market
Our Rental Yield Factor Measures Yield Correctly. Inside a District It Points the Wrong Way.
24 October 2026Private Property Market
Holding Longer Doesn't Raise Your Return. It Narrows the Spread by Two-Thirds.
22 October 2026Private Property Market
One-Bedders Yield More. In the Same Building, They Appreciate Half as Fast.
Next step
TRIBE Research
Written with AI assistance from TRIBE's own data and the public sources listed, then checked against them. General information, not financial advice. How we write
How TRIBE scores and checks its analysis
Spotted an error, or a figure that has moved since publication? Tell us and we will correct it.
General information only, not financial, investment, legal or tax advice. It does not consider your own circumstances; check your own numbers before you commit.