Insights
Our Rental Yield Factor Measures Yield Correctly. Inside a District It Points the Wrong Way.
Checked against 186,444 rental contracts and 23,661 resale prices, the yield we publish for a condo lands within 0.2 points of the market. But hold district and tenure still and its high scorers gain 1.6 points of rent and lose 2.6 of capital.
By TRIBE Research · 25 October 2026 · 9 min read
Every condo on TRIBE's resale scorecard carries a Rental Yield score out of ten, and that score is 10% of the overall grade. Checked against the market, it is accurate. The yield we publish for a project sits within 0.2 points of what its own rents and prices actually say, on 1,060 projects where both can be measured.
Accurate is not the same as useful. Hold a district and a tenure still, and the projects scoring highest on Rental Yield out-earned the lowest ones by 1.6 points of income — while giving up 2.6 points of annual capital return to do it. That happened in nine cells out of nine.
A yield is a ratio, and we score the whole ratio. Most of what moves it is the denominator.
The number is right
The scorecard states a yield figure for every project it scores: "Rental yield of 4.49% — strong income return." That is a checkable claim, so we checked it. Pairing TRIBE's 36-month rental file against resale caveats from the same project gives an independent gross yield — median rent per square foot, annualised, over median transacted psf.
Across 1,060 projects with at least five rental contracts, three sales since October 2024 and five matched repeat sales, the published figure and the observed one agree: a median gap of +0.06 points, a median absolute gap of 0.19 points, and 97.5% of projects inside one point. Rank correlation between the 1–10 score and observed yield is +0.871.
So the factor is not broken. It is measuring the thing on its label. The question is what that thing is made of.
A yield is two numbers
Rent is the numerator and price is the denominator, and the score moves on both — in opposite directions. Correlating the score against each half separately: +0.343 against rent per square foot, −0.373 against transacted psf. Price does marginally more of the work than rent.
Read across the score bands and you can see it:
| Rental Yield score | Projects | Rent psf/mo | Sale psf | Observed yield |
|---|---|---|---|---|
| 0–2 | 168 | $4.12 | $2,133 | 2.30% |
| 3–4 | 392 | $4.50 | $1,841 | 2.94% |
| 5–6 | 281 | $4.62 | $1,584 | 3.52% |
| 7–8 | 190 | $5.78 | $1,665 | 4.02% |
| 9–10 | 29 | $5.27 | $1,545 | 3.70% |
From the bottom band to the 7–8 band, rent per square foot rises 40.3% and price per square foot falls 21.9%. Both move the ratio the same way. A high Rental Yield score therefore says two things at once — this building rents well, and this building is cheap — and the scorecard cannot tell you which one it is reacting to. We have made the same argument about HDB flats, where it is starker: the highest-yielding flats are in Jurong, and that is arithmetic, not insight.
What the rent costs
That matters because the denominator is also a price, and prices move. Every caveat in TRIBE's resale dataset carries the seller's own purchase price and date, which turns 53,814 of these transactions into matched repeat sales of the same unit — an annualised capital return with no index and no model. Income and capital return on the same project, same table:
| Rental Yield score | Projects | Observed yield | Annualised capital return | Sum |
|---|---|---|---|---|
| 0–2 | 168 | 2.30% | 4.07% | 6.37% |
| 3–4 | 392 | 2.94% | 3.42% | 6.35% |
| 5–6 | 281 | 3.52% | 2.89% | 6.41% |
| 7–8 | 190 | 4.02% | 2.58% | 6.59% |
| 9–10 | 29 | 3.70% | 4.19% | 7.89% |
The first four rows are the finding. Income return climbs 1.7 points across them. Capital return falls 1.5. The sum sits between 6.35% and 6.59% — a quarter-point band across a factor that spans eight of its ten points. Rank correlation between the score and the two components is +0.871 and −0.218; between the score and their sum, +0.162. Yield and capital return themselves correlate −0.442.
This is the same offset we found running bedroom counts within a single building, where one-bedders yield more and appreciate half as fast. Here it shows up across projects.
Hold the district still
Pooled tables invite the obvious objection: cheap projects are suburban, and suburb and district are doing the work. So fix the district and compare projects scoring 3 or below against projects scoring 6 or above inside it.
| District | Low n | High n | Yield | Capital | Sum |
|---|---|---|---|---|---|
| D09 | 55 | 10 | +1.67 | −1.58 | +0.09 |
| D10 | 91 | 4 | +1.26 | −1.92 | −0.67 |
| D12 | 14 | 20 | +1.46 | −2.61 | −1.16 |
| D14 | 7 | 51 | +1.51 | −2.48 | −0.97 |
| D15 | 59 | 15 | +1.74 | −2.00 | −0.26 |
| D19 | 15 | 33 | +0.64 | −0.94 | −0.30 |
| D21 | 25 | 6 | +0.97 | −2.02 | −1.05 |
| D23 | 15 | 20 | +1.05 | −1.41 | −0.35 |
Across the thirteen districts with enough projects at both ends, the high scorers out-yielded the low scorers in 13 of 13, by a median 1.05 points. They under-appreciated in 13 of 13, by a median 1.58 points. On the sum of the two they came out ahead in only 3 of 13, median −0.35 points.
Tighten it once more to projects in the same district and the same tenure — nine cells survive that cut — and the high scorers out-yield in 9 of 9 by 1.57 points, under-appreciate in 9 of 9 by 2.64 points, and beat the low scorers on the sum in none of the nine, median −1.16 points.
Tenure alone tells the same story. On the 600 freehold projects in the sample, income return climbs from 2.29% to 4.39% as the score rises and capital return falls from 4.09% to 1.55% — so the total return declines, from 6.39% in the bottom band to 5.47% in the middle and 5.94% in the 7–8 band.
The exception at the top is a policy artefact
The 9–10 row is the one that breaks the pattern, at 7.89%. It is also the row with 29 projects in it, and it is worth naming what they are.
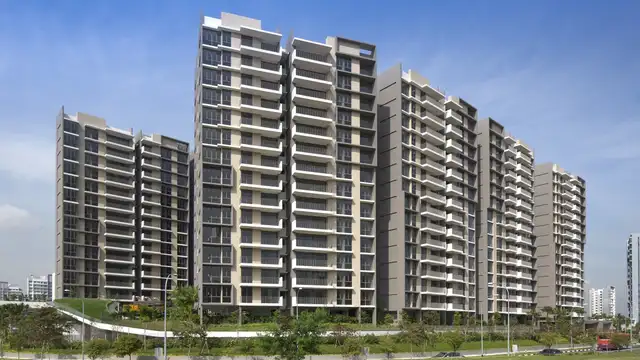
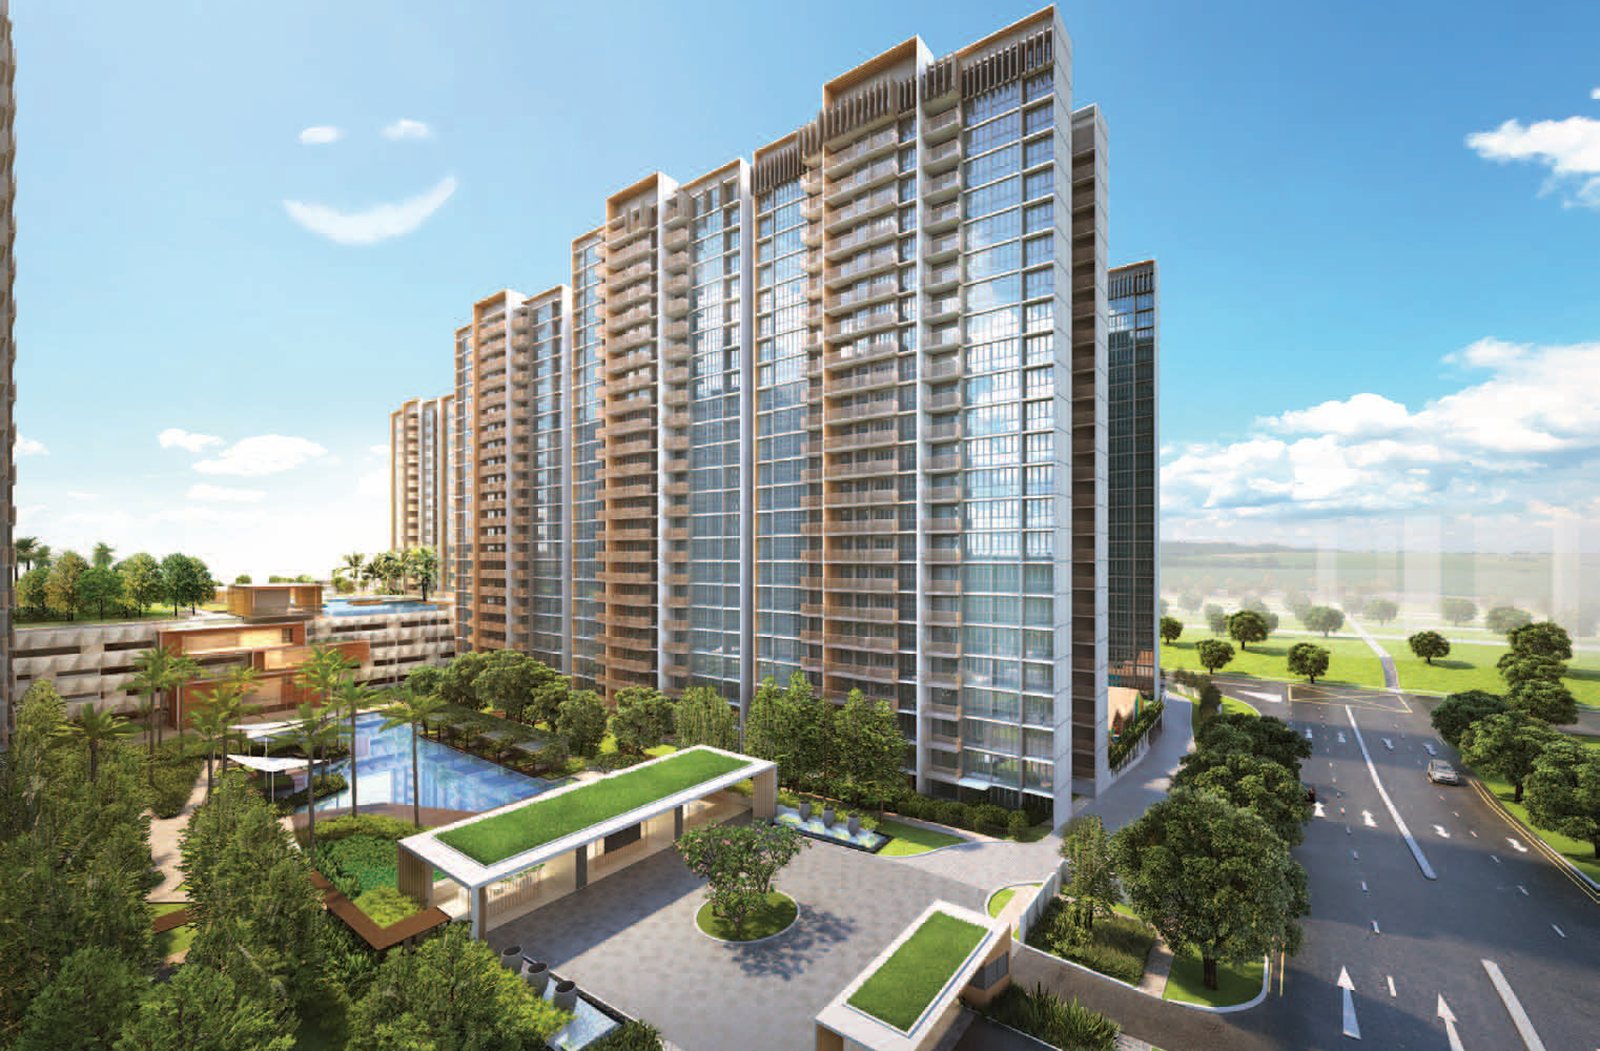
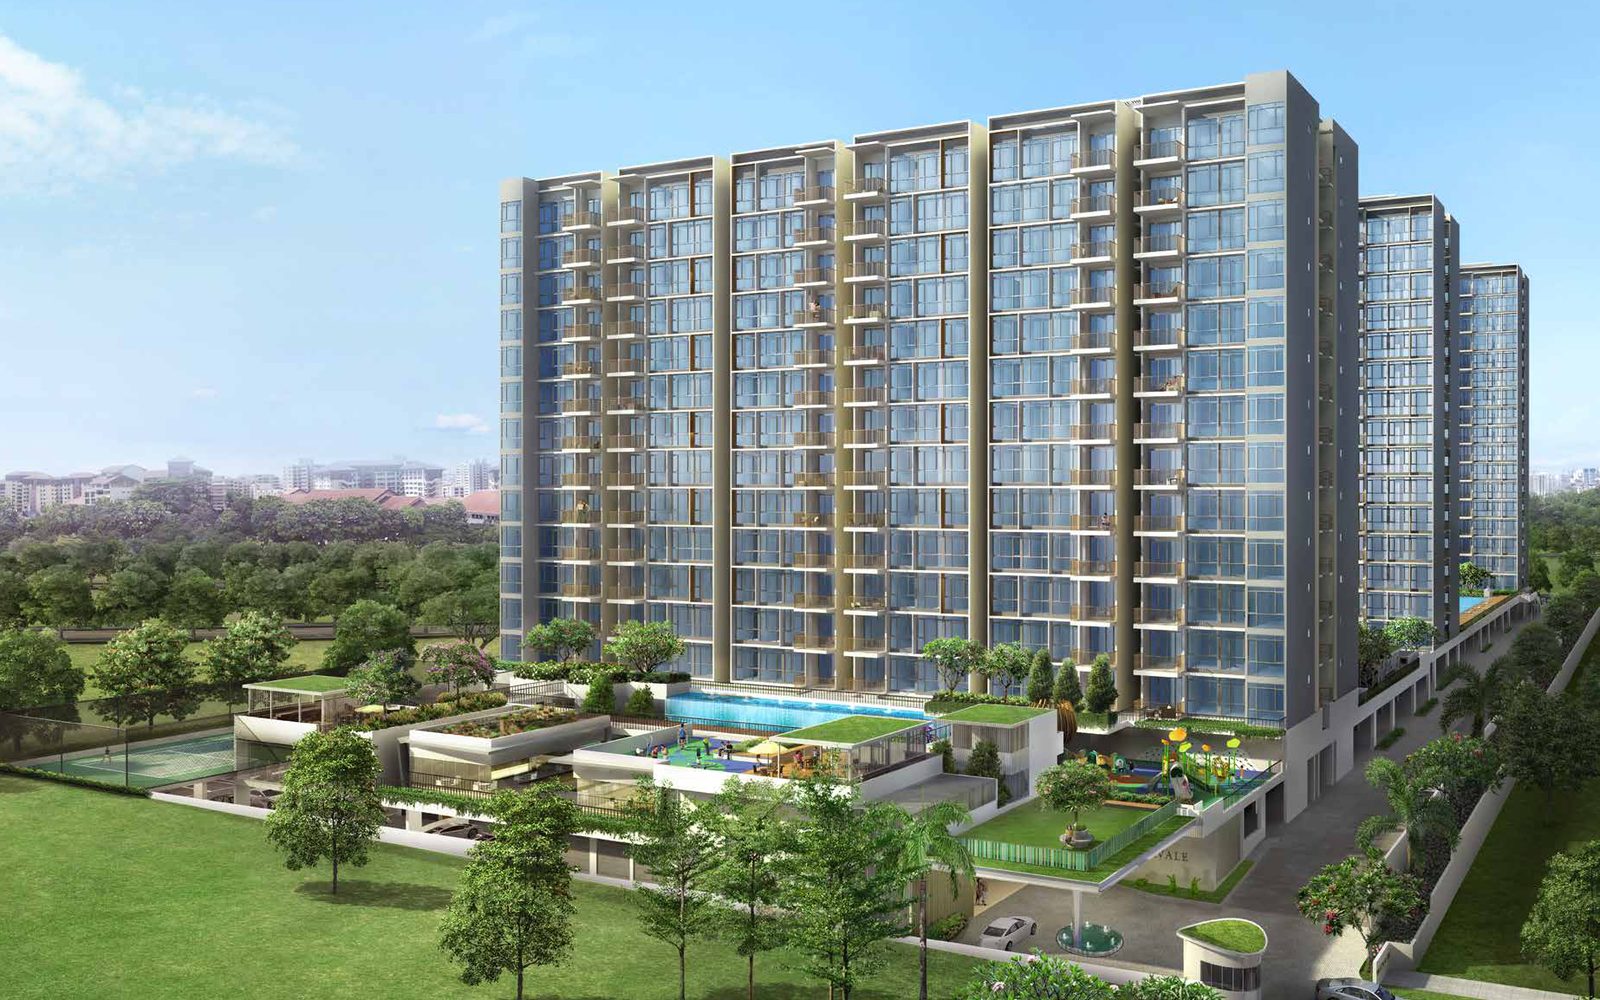
Of the twelve highest-scoring leasehold projects in that band, at least seven are executive condominiums: Treasure Crest, Hundred Palms Residences, The Criterion and Sol Acres at a score of 10, Wandervale, The Brownstone and iNz Residence at 9. Their annualised capital returns run from 6.68% to 10.44% — roughly double the sample median of 3.29%.
That is not a yield effect. An EC is sold below market to income-capped first-time buyers and cannot be resold on the open market for ten years; the gap closes when the minimum occupation period ends. All seven completed between 2017 and 2019, which put their MOP squarely inside this five-year transaction window. The scorecard did not identify a high-yielding investment. It identified a subsidy unwinding, and scored the cheap entry price that produced it.
Drop those seven and the top band's total return falls from 7.89% to 7.45% on 22 projects. Some of the outperformance survives; the mechanism behind most of it does not generalise to anything a resale buyer can act on today.
What this does not show
These are gross yields. Property tax at non-owner-occupier rates, MCST fees, vacancy, repairs and leasing commission all come out before anything reaches a landlord — roughly a third of the headline, on a worked case. Net of costs the income column shrinks and the offset gets worse, not better.
Capital returns are measured only on units that sold. Owners sitting on losses tend not to transact, so every return here is drawn from a sample that chose to exit.
Both columns are nominal, and the capital figures come from a single five-year window in which the suburban market ran hard. A different window would move the levels; to change the conclusion it would have to move both columns the same way.
On coverage: 1,060 of 2,350 scored projects clear the data bar, skewed towards larger and more liquid developments. Of the full board, 72 projects score 0 on this factor and 47 carry a district average in place of project-level rents because too few contracts were filed — those sit at scores 1 through 5 and are measured less precisely than the rest.
What we are changing
Nothing about the number. It is right.
What we are changing is the reading. Rental Yield moves the overall score about as much as MRT Proximity and less than a third as much as Primary School Effect or Project's Historical Performance — the same problem we described when three factors turned out to be 29% of the score and 1% of the difference. A factor contributing little spread, half of it price, is not carrying its 10%.
For a buyer it is simpler. Buying for income, Rental Yield is the right field to read, and expect the appreciation to be worse — that is the trade, roughly 1.6 points of rent for 2.6 of capital inside a district. Buying for total return, read it as a price tag rather than a quality mark and weight Project's Historical Performance instead.
And if a project scores 9 or 10, check whether it is an executive condominium before you conclude anything at all.
From 1,060 private condominium projects across 26 districts that appear on TRIBE's resale scorecard with enough data to measure both halves of a return: at least five rental contracts in the 36-month window to August 2026 (186,444 contracts in total), at least three resale or sub-sale transactions since October 2024 (23,661), and at least five matched repeat sales of the same unit held a year or longer (53,814). Yields are gross, computed as median rent per square foot annualised over median transacted psf. Capital returns are nominal, price-to-price, annualised from the seller's own purchase price and date, and gross of rent, costs and financing. Scorecard data is the live build of 2,350 projects served at /rps-data-v2.json; factor weights are as published at our methodology page. All figures are medians. This is general information, not investment advice.
Condos in this article


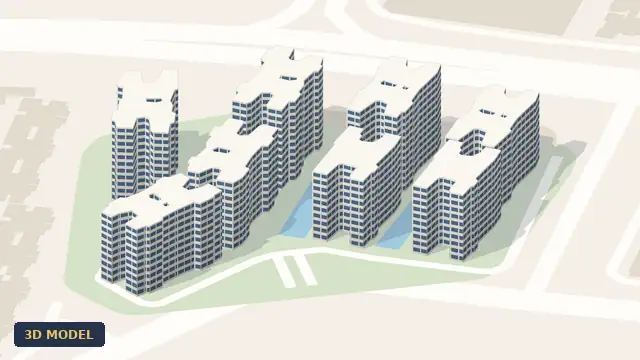
Check how your condo scores
2,350 condos independently scored across 7 weighted factors. No registration required.
Score my resale →Prefer a personal read on your situation? Arrange a consultation →Keep reading
24 October 2026Private Property Market
Holding Longer Doesn't Raise Your Return. It Narrows the Spread by Two-Thirds.

22 October 2026Private Property Market
One-Bedders Yield More. In the Same Building, They Appreciate Half as Fast.

21 October 2026Private Property Market
The Primary School Premium Is Negative Until You Hold the District Still
Next step
TRIBE Research
Written with AI assistance from TRIBE's own data and the public sources listed, then checked against them. General information, not financial advice. How we write
How TRIBE scores and checks its analysis
Spotted an error, or a figure that has moved since publication? Tell us and we will correct it.
General information only, not financial, investment, legal or tax advice. It does not consider your own circumstances; check your own numbers before you commit.