Insights
The Highest-Yielding Flats Are in Jurong. That Is Arithmetic, Not Insight.
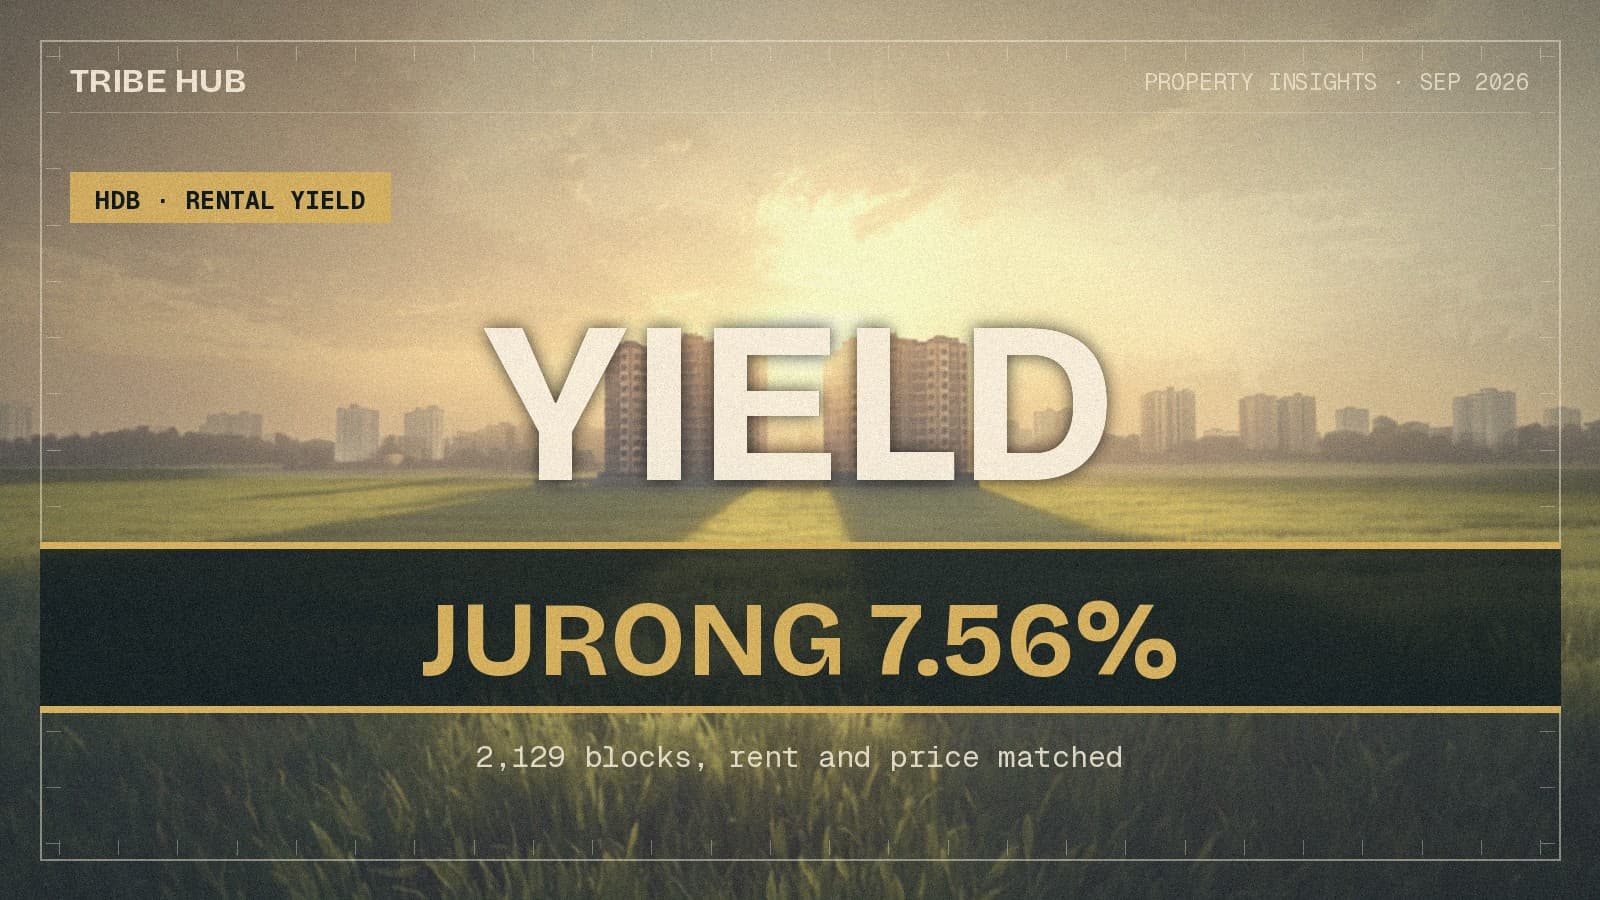
Matched block by block, a four-room flat yields 7.56% gross in Jurong West and 5.06% in Queenstown. The Queenstown flat costs 97% more and rents for 27% more. The yield map is the price map, upside down.
By TRIBE Editorial · 15 September 2026 · 7 min read
Rental yields on HDB flats in the west are running ahead of the rest of the island, and the usual explanation is that Jurong has an employment base — industrial estates, the business park, the hospital — that supports tenant demand. That explanation is true and it is almost entirely beside the point.
Yield is rent divided by price. Across Singapore's towns, rent barely moves and price moves enormously. What looks like a map of rental demand is a map of what flats cost, turned upside down.
How this was measured
Town-level yield comparisons have a hole in them: the flats being rented in a town are not the flats being sold there. Different blocks, different ages, different flat types.
So we matched them. HDB publishes resale transactions and rental approvals with block and street on every record. Pairing 2026 sales with 2026 rentals at the same block, same street and same flat type — and keeping only pairs with at least two of each — gives 2,199 matched cells across 2,129 blocks. Every yield below is a rent and a price from the same building.
The map
Four-room flats, towns with at least ten matched blocks:
| Town | Gross yield | Median price | Median rent |
|---|---|---|---|
| Jurong West | 7.56% | S$539,222 | S$3,400 |
| Jurong East | 7.26% | S$575,750 | S$3,475 |
| Woodlands | 6.92% | S$535,000 | S$3,050 |
| Ang Mo Kio | 6.88% | S$580,000 | S$3,400 |
| Yishun | 6.88% | S$542,000 | S$3,075 |
| Bedok | 6.78% | S$567,750 | S$3,312 |
| Choa Chu Kang | 6.74% | S$540,000 | S$3,100 |
| Bukit Batok | 6.67% | S$579,000 | S$3,275 |
| Hougang | 6.52% | S$584,500 | S$3,250 |
| Sembawang | 6.49% | S$532,750 | S$3,200 |
| Bukit Panjang | 6.34% | S$598,000 | S$3,000 |
| Serangoon | 6.23% | S$680,722 | S$3,500 |
| Tampines | 6.19% | S$644,722 | S$3,425 |
| Sengkang | 5.94% | S$650,000 | S$3,200 |
| Pasir Ris | 5.87% | S$643,250 | S$3,400 |
| Bishan | 5.83% | S$781,500 | S$3,750 |
| Punggol | 5.78% | S$680,750 | S$3,300 |
| Clementi | 5.71% | S$812,722 | S$4,075 |
| Geylang | 5.45% | S$660,000 | S$3,700 |
| Kallang/Whampoa | 5.39% | S$830,000 | S$3,800 |
| Bukit Merah | 5.31% | S$936,750 | S$4,100 |
| Toa Payoh | 5.06% | S$905,472 | S$3,825 |
| Queenstown | 5.06% | S$1,061,500 | S$4,325 |
Jurong West does lead. But read the two right-hand columns rather than the left one. The dearest town on this list costs 1.99 times the cheapest; the dearest rent is only 1.44 times the cheapest. Fit rent against price across the 23 towns and a 1% higher price buys just 0.45% more rent. The correlation between a town's price and its yield is minus 0.88 — yield is very nearly a restatement of price with the sign flipped.
A tenant is renting a three-bedroom home twenty minutes further out. That is worth something, but not much — it is worth a few hundred dollars a month. A buyer is buying an address, and an address in Queenstown costs half a million dollars more than one in Jurong West.
The same pattern inside a single town
If the yield gradient were about tenant demand, it would not repeat across flat types within the same market. It does:
| Flat type | Gross yield | Median price | Median rent |
|---|---|---|---|
| Three-room | 7.90% | S$420,000 | S$2,800 |
| Four-room | 6.26% | S$620,000 | S$3,300 |
| Five-room | 5.81% | S$710,000 | S$3,500 |
| Executive | 4.97% | S$895,000 | S$3,750 |
A three-room flat costs less than half what an executive flat costs and rents for 75% of the price. Bigger flats yield less, everywhere, for the same reason expensive towns yield less: rent is paid for shelter, which saturates, while price capitalises land, location and lease, which do not.
What the number is not
It is not an investment case, because the asset is not investable in the ordinary sense.
Renting out a whole HDB flat requires the owner to have completed the five-year minimum occupation period, and only Singapore Citizen owners may do it — permanent residents cannot rent out the whole flat at all. Prime and Plus flats cannot be rented out whole even after their ten-year MOP. The minimum lease is six months, so short-stay letting is out.
Which means nobody buys a Jurong West four-room at 7.56% the way they would buy a bond at 7.56%. The yield accrues only to someone who already owns the flat, has lived in it five years, and is willing to move out of it.
And the gross number is not the number. On the islandwide median — S$620,000, S$3,300 a month — a realistic set of deductions runs:
- Service and conservancy charges: about S$1,080 a year
- Agent commission: half a month per two-year lease, about S$825 a year
- Vacancy: two weeks between tenancies, about S$770 a year
- Repairs and replacement: about S$1,500 a year
That is roughly S$4,175, taking S$39,600 gross down to S$35,425 — 6.39% gross becomes 5.71% before any tax. Property tax then applies at non-owner-occupied rates, which are materially higher than the owner-occupied rates the flat was paying, and net rental income is taxable at the owner's marginal rate on top. We have set out the full gross-to-net walk elsewhere.
What it is actually useful for
The block-matched yield is not a buy signal. It is a price on an option the owner already holds.
If a Jurong West four-room throws off S$3,400 a month and a Queenstown four-room throws off S$4,325, then the owner considering moving out and letting the flat is looking at the same S$925 monthly difference that the tenant is — not the half-million-dollar difference in what the two flats are worth. The rental market prices the flat. The sale market prices the address. Only one of those two markets is paying you for the address.
That asymmetry is the whole finding, and it points the same way in every town: if the address is most of what you paid for, renting the flat out is the worst way to realise it, and selling is the only way. The decision between those two is the one worth spending time on — and it turns on what the flat is worth against what it earns, not on which town tops a yield table.
Figures computed from HDB's resale flat transaction dataset and renting-out-of-flats approval dataset published on data.gov.sg, both downloaded 15 September 2026. Resale transactions are those registered in 2026 (18,278 records); rental approvals are those dated January to August 2026 (24,897 records), which is the full extent of the published rental series. Blocks are matched on town, block number, street name and flat type, retaining cells with at least two sales and two rental approvals — 2,199 cells across 2,129 blocks in 25 towns. Yields are gross: median annualised rent divided by median resale price, computed per cell and then aggregated as the median across cells. Net-yield deductions are stated assumptions, not observed costs, and exclude property tax and income tax. Methodology published. No spin.
Know what you can afford
Loan, stamp duty, CPF, and monthly repayments — work out your real budget before you commit. No registration required.
Plan my purchase →Prefer a personal read on your situation? Arrange a consultation →Keep reading

TRIBE Editorial · Reviewed by Silas Tan
Co-Founder, TRIBE · District Director, Huttons Asia · Ex-Mortgage Banker (AVP) · >1,000 families advised · CEA R000303I
This article is for informational purposes only and does not constitute financial or investment advice.