
Insights
Three Factors Are 29% of Our Scorecard and 1% of the Difference
MRT Proximity, Tenure and Future Transformation carry 29% of the weight on TRIBE's resale scorecard. Across all 2,350 scored condos they explain 1.1% of the spread in scores. Rank the market on those three alone and the order comes out no better than random.
By TRIBE Editorial · 20 October 2026 · 9 min read
Every resale condo listing leads with the same two facts: freehold or leasehold, and how many minutes to the MRT. They are the first two lines of the brochure and usually the first two questions a buyer asks. On TRIBE's Resale Project Scorecard they are worth 23% of the published weight between them.
They are worth almost none of the difference. Across all 2,350 scored condos, MRT Proximity, Tenure and Future Transformation carry 29% of the weight and account for 1.1% of the variation in scores. Two hundred and twenty-five projects score a perfect 10 on both MRT and tenure. Their average score is 5.95. The average across every scored condo is 5.99.
This is the scorecard read against itself.
What the score is made of
Each condo gets a 1–10 score on seven factors. Those are weighted and summed, and the published weights are these:
| Factor | Weight |
|---|---|
| Project's Historical Performance | 25% |
| Primary School Effect | 20% |
| Project Size | 16% |
| MRT Proximity | 13% |
| Rental Yield | 10% |
| Tenure | 10% |
| Future Transformation | 6% |
Applying that formula to the seven published sub-scores reproduces the published RPS score for all 2,350 projects: mean error 0.000, largest single error 0.03, which is the rounding of sub-scores to whole numbers. Everything below runs on the same public file the site serves.
Weight is not separation
A weight says how much of a score a factor accounts for. What decides where a project lands in the ranking is something else: how much projects differ from each other on that factor. A factor everyone scores the same on adds the same amount to every score and separates nobody.
Split the variation in scores across the seven factors — an exact decomposition, so the column sums to 100% — and the two columns do not match.
| Factor | Weight | Share of the spread |
|---|---|---|
| Primary School Effect | 20% | 41.5% |
| Project's Historical Performance | 25% | 33.9% |
| Project Size | 16% | 17.2% |
| Rental Yield | 10% | 6.2% |
| MRT Proximity | 13% | 2.1% |
| Future Transformation | 6% | 0.3% |
| Tenure | 10% | −1.3% |
Schools and historical performance are 45% of the weight and three quarters of the sorting. Add project size and you have 61% of the weight doing 92.6% of the work. Rank all 2,350 condos on those three factors alone and the order matches the full ranking at a Spearman correlation of 0.958. On schools and historical performance alone it is 0.903.
Rank them on the other 29% — MRT, tenure and future transformation — and the correlation with the real ranking is −0.02. Not weak. Nothing.
The blunter version of the same test: draw two condos at random whose scores differ by at least half a point, and ask which one wins on those three factors. Across 294,208 such pairs, the winner on MRT, tenure and future transformation is the project with the lower overall score 49.5% of the time. A coin would do as well.
Almost everyone already passes
The reason is in the distributions. Singapore is small and old leases are rare, so most of the market clears these three bars at once.
- Tenure. 1,802 of 2,350 projects score a perfect 10 — exactly the 1,680 freehold, 121 999-year and one 929-year projects, which is what the published rule says should happen. Only 548 projects are scored on a remaining lease at all.
- MRT Proximity. 68.7% of projects score 8 or better; 372 score 10.
- Primary School Effect, for contrast, has 418 projects on 10 and 683 on 3 or below. That is a factor with somewhere to put a project.
It shows up again in where the perfect scores land. Of the 1,802 projects with full marks on tenure, 54.9% sit below the median score. Of the 418 with full marks on schools, 7.7% do.
Tenure pulls slightly the wrong way
The negative sign on tenure is not a rounding artefact. Look at the average tenure score by grade:
| Grade | Projects | Avg score | Avg tenure score |
|---|---|---|---|
| S | 218 | 8.00 | 8.47 |
| A | 486 | 6.88 | 9.34 |
| B | 947 | 5.96 | 9.46 |
| C | 479 | 5.07 | 9.49 |
| D | 220 | 4.18 | 9.05 |
The best-graded projects on the board have the worst average tenure of any grade above D.
This is not a verdict on freehold, and it should not be read as one. It is composition. The median freehold project on the scorecard holds 42 units; the median 99-year project holds 410. On the 16% Project Size factor — which rewards the 500-to-800-unit range for the liquid resale market and viable maintenance pool it produces — freehold projects average 3.75 and leasehold projects average 7.57. Tenure is standing in for size, and size is the heavier factor. We took the same confound apart on prices in Freehold vs 99-Year: What the Data Actually Says.
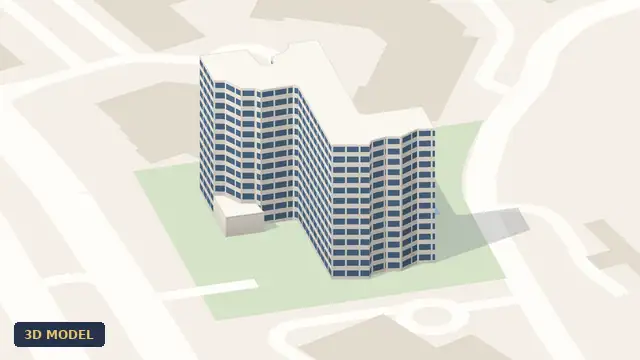
The 225 projects with perfect marks on both MRT and tenure show the whole range it leaves open: 17 of them are S grade and 22 are D. 8 Napier in D10 is freehold and 130m from Napier station, which is as good as the tenure and MRT factors get. It has no primary school within a kilometre, and its cohort-relative price performance of −0.86% a year puts it in the bottom 15% of its 2010 vintage. It scores 1 on schools, 2 on historical performance, and 3.87 overall. The Calrose in D26 is also freehold and 90m from Lentor station — the same perfect pair — but it has three primary schools within a kilometre and +4.79% a year against its 2007 cohort, top 9%. It scores 10 on both and 8.48. RPS never scores price, prestige or the quality of the building; a low score on a small prime project is a statement about resale-demand fundamentals and nothing else.
What actually sorts the table
The gap between the average S-grade project and the average D-grade project is 3.82 points. Three factors produce 91.6% of it:
| Factor | Points of the S–D gap | Share |
|---|---|---|
| Primary School Effect | +1.48 | 38.7% |
| Project's Historical Performance | +1.24 | 32.6% |
| Project Size | +0.78 | 20.3% |
| Rental Yield | +0.24 | 6.2% |
| MRT Proximity | +0.08 | 2.1% |
| Future Transformation | +0.06 | 1.6% |
| Tenure | −0.06 | −1.5% |
Schools, track record, size. That is the scorecard, in practice.
What this is and what it is not
It is a statement about separation among the 2,350 condos on this list, not about what matters to a household. MRT proximity fails to sort this table because almost everything on it is already near an MRT — not because being near an MRT is worth nothing. Put a development with no station within two kilometres on the list and the factor would do plenty of work. This is restriction of range, and it is the honest reason the number is small.
Three further limits. Sub-scores are whole numbers from 1 to 10, which compresses real differences, most of all at the top of the range where tenure sits. The decomposition is descriptive — an exact covariance split of published scores, not a causal claim about prices. And a weight is a statement about what should count in a long-run view of demand; a share of spread is a statement about what currently distinguishes one Singapore condo from another. Those are different questions, and the gap between them is the finding here. None of this changes the published weights.
How to read a scorecard
When two projects sit a grade apart, the gap is almost always in three lines: the Primary School Effect, the Project's Historical Performance, and Project Size. Read those three first and you will have accounted for roughly nine tenths of why one scored higher than the other.
And when two projects are close on those three, the scorecard is telling you something real: they are close. The decision then moves off the scorecard entirely — onto price, layout, facing, floor, the actual walk to the station, and the lease you will be holding in fifteen years. Tenure and MRT distance are still facts worth knowing about a home. They are just not the facts that tell these homes apart.
Method
Computed from rps-data-v2.json as served at tribesg.com/rps-data-v2.json, retrieved 20 October 2026: 2,350 scored resale condominium projects, each with seven integer sub-scores, a published RPS score and a letter grade. Factor weights are the published ones (Project's Historical Performance 25%, Primary School Effect 20%, Project Size 16%, MRT Proximity 13%, Rental Yield 10%, Tenure 10%, Future Transformation 6%). Scores used throughout are recomputed as Σ(sub-score × weight) ÷ 100 rather than read from the published field, so that the decomposition is internally exact; the two agree to a mean difference of 0.000 and a maximum of 0.03 across all 2,350 projects. "Share of the spread" is the covariance decomposition of the total score's variance, cov(wᵢxᵢ, total) ÷ var(total), which is exact and sums to 100% by construction; a factor can take a negative share when it correlates negatively with the rest of the card, as tenure does. Rank correlations are Spearman's rho on the full set of 2,350. The pair test draws 400,000 random pairs with a fixed seed, discards those whose scores differ by less than 0.5, and reports the 294,208 that remain; 2.7% of those tie on the three-factor block and are counted in the denominator. Grade-band figures are unweighted means within each published grade. Grades are relative cuts, not fixed thresholds, and move slightly with each quarterly refresh, so the band averages here are a snapshot of this file. The scorecard does not score price, asking PSF or build quality, and nothing in this piece is a view on any individual project's value; it is a description of how our own published weights behave across the market they are applied to.
Condos in this article

Check how your condo scores
2,350 condos independently scored across 7 weighted factors. No registration required.
Score my resale →Prefer a personal read on your situation? Arrange a consultation →Keep reading

12 October 2026Private Property Market
Five Foreigners Were Approved to Buy a Good Class Bungalow in a Decade. None Since 2021.

11 October 2026Private Property Market
One S$70 Million Deal Decides Whether the Shophouse Quarter Was Up or Down

10 October 2026Private Property Market
A Record S$42.4 Billion. A Quarter of It Was the Government Selling Land.
Next step

TRIBE Editorial · Reviewed by Silas Tan
Co-Founder, TRIBE · District Director, Huttons Asia · Ex-Mortgage Banker (AVP) · >1,000 families advised · CEA R000303I
How TRIBE scores and checks its analysis
Spotted an error, or a figure that has moved since publication? Tell us and we will correct it.
This article is for informational purposes only and does not constitute financial or investment advice.