Insights
Freehold vs 99-Year: What the Data Actually Says
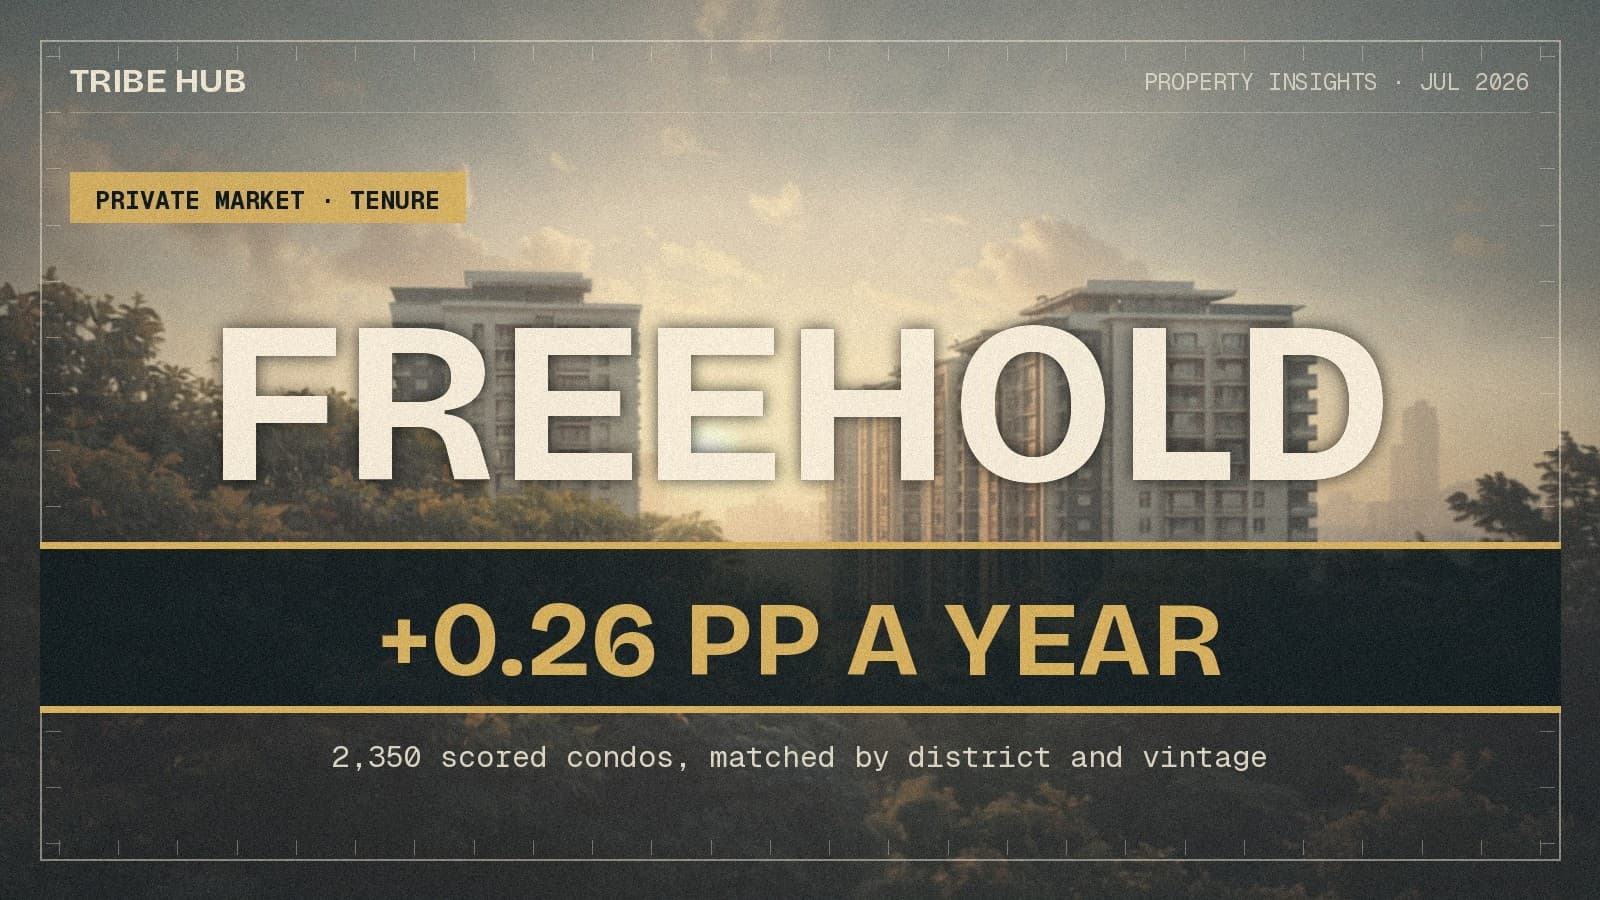
Across 2,350 scored condos, leasehold projects show a slightly higher annualised price gain than freehold ones. That result survives about ten seconds of scrutiny — and what breaks it is the most useful thing in the dataset.
By TRIBE Editorial · 29 July 2026 · 7 min read
The freehold-versus-leasehold argument is usually conducted entirely in theory: a lease decays, freehold doesn't, therefore freehold appreciates better. It is a clean argument. It is also testable, because the Resale Project Scorecard carries a realised annualised price-growth figure for every scored project — 2,350 of them with a usable number, 1,800 freehold or 999-year, 550 on a 99-year lease.
Run the comparison straight and the theory loses. Median annualised growth is 3.00% for leasehold projects and 2.78% for freehold. On means it is 2.81% against 2.60%, same direction.
That headline is worth almost nothing, and it is worth going through why — because the reasons are the actual answer to the question.
The two tenures are not the same portfolio
Freehold and leasehold condos in Singapore are structurally different stock. Freehold skews central and small: 34% of freehold projects sit in the core central region against 17% of leasehold, and the median freehold project has 42 units while the median leasehold project has 406. Seventy-eight per cent of freehold projects have fewer than 100 units; only 12% of leasehold projects do. Leasehold, meanwhile, is 54% outside central region — the part of the market that ran hardest over the last decade.
So a raw tenure comparison is mostly a comparison of a boutique-central portfolio against a mass-market-suburban one. Split by vintage and the picture inverts:
| Completion cohort | Freehold / 999yr | 99-year |
|---|---|---|
| Before 2010 | 3.44% (n=1,157) | 3.20% (n=242) |
| 2010–2019 | 1.18% (n=539) | 2.54% (n=222) |
| 2020 onwards | 0.72% (n=104) | 2.20% (n=86) |
Mature stock favours freehold. Everything built since 2010 favours leasehold, heavily. That is not lease decay running backwards — it is the 2010s freehold boutique wave, the small walk-up blocks built on collective-sale sites in D14, D15 and D19, which entered at high per-square-foot prices and have gone close to nowhere since.
Size explains almost all of it
Hold the decade constant and sort by project size instead:
| 2010s cohort, by units | Freehold / 999yr | 99-year |
|---|---|---|
| Under 100 units | 1.19% (n=391) | 0.52% (n=12) |
| 100–299 units | 1.06% (n=132) | 0.90% (n=35) |
| 300–599 units | 2.20% (n=15) | 2.63% (n=109) |
| 600+ units | — (n=1) | 3.13% (n=66) |
Within each size band the two tenures are close, and in the small bands freehold is ahead. The 2010s gap in the previous table is a composition effect: freehold is the small-project bucket, and small projects underperformed. Tenure was standing in for scale.
The matched test
The cleanest cut available is to compare like with like — same district, same completion decade — and only where both tenures have at least three projects in the cell. That yields 48 cells:
| Decade | Cells | Median gap (99yr − freehold) | Cells where leasehold led |
|---|---|---|---|
| 1990s | 11 | −0.38 pp | 1 |
| 2000s | 11 | −0.36 pp | 0 |
| 2010s | 15 | +0.30 pp | 8 |
| 2020s | 7 | +1.54 pp | 5 |
| All | 48 | −0.26 pp | 17 |
Matched on location and vintage, freehold wins by a median 0.26 percentage points a year — and the win is concentrated in the mature cohorts, where it is consistent to the point of near-unanimity (the 2000s cohort: leasehold led in zero of eleven cells). In the newer cohorts leasehold leads, which is the boutique-scale effect again rather than anything about the lease.
By region, the same story: in the CCR, freehold projects median 2.21% against leasehold 1.29%. In the RCR the two are effectively tied (3.07% vs 3.16%), and in the OCR they are tied again (3.22% vs 3.15%). The freehold premium is real where freehold stock is genuinely scarce, and it disappears in the suburbs where the competing product is a large well-located leasehold development.
The tails, and the executive-condo caveat
Freehold makes up 77% of the scored set but only 62% of the fifty strongest performers — and 76% of the fifty weakest. The share of projects with outright negative annualised growth is almost identical: 5.9% of freehold, 5.8% of leasehold. Freehold is not a floor.
One honest qualification on the leasehold top tail: several of the strongest 99-year performers are executive condominiums — Hundred Palms Residences, Treasure Crest, Wandervale — which launch at a subsidised, income-capped price and re-rate when they privatise. That is a policy mechanism, not a tenure one, and it flatters the leasehold distribution. Strip the EC effect and the strongest leasehold results are large, MRT-adjacent suburban projects such as The Centris in D22 (99-year, 2009, 610 units), whose scorecard reads "Avg Ann. of +4.57% places this condo in the top 6% of its 2009-era cohort" and which grades S at 9.3. Location and scale, again.
What the number is, and what it isn't
The figure used throughout is the project-level annualised resale price growth the scorecard computes from transacted data over its ten-year window. It is not total return: it excludes rent, stamp duty, financing and selling costs. Projects removed by collective sale drop out of the set, which mildly flatters the survivors on both sides. Small projects transact thinly, so their annualised figures carry more noise — one reason the boutique-freehold cohort has such a wide spread.
The window also matters. Ten years of Singapore prices ending in 2026 covers a broadly rising market, and the oldest leasehold projects in the set still have roughly 65 to 70 years left. A decade of data cannot see the part of lease decay that bites after year 60. The scorecard prices that separately — remaining tenure is its own factor, which is why a 79-year lease scores 7 while a fresh 99 or a freehold title scores 10. Realised growth and residual-risk are two different questions, and this article only answers the first.
The practical read
Tenure is a second-order variable. It is worth roughly a quarter to a third of a percentage point a year on matched stock, and it is swamped by three things that are each worth multiples of it: which region you buy in, how large and liquid the project is, and what vintage you enter at. A freehold title on a 40-unit walk-up with no MRT within a kilometre has lost to a 500-unit leasehold project next to a station, repeatedly, across the entire dataset.
The corollary is about price, not performance. The measured freehold edge is about 0.3 percentage points a year. If the freehold option in front of you costs 15–20% more per square foot than the comparable leasehold one, the arithmetic asks you to hold it a very long time before the tenure earns that premium back. That is the calculation to run — not the theory.
Methodology published. No spin.
Sources: All figures computed by TRIBE from the published Resale Project Scorecard dataset (2,357 scored projects; 2,350 carrying a realised annualised growth figure and a 99-year or freehold/999-year tenure), current as at July 2026. Annualised growth is the scorecard's project-level figure derived from transacted resale data over its ten-year window. Region groupings follow the standard CCR/RCR/OCR district split. Matched cells require at least three projects of each tenure in the same district and completion decade. Executive condominium status noted from public launch records.
Silas Tan is a District Director at Huttons Asia and co-founder of TRIBE. This article is for informational purposes and does not constitute financial or investment advice. CEA Registration R000303I.
Check how your condo scores
2,357 condos independently scored across 7 weighted factors. No registration required.
Score my resale →Prefer a personal read on your situation? Arrange a consultation →Keep reading

19 September 2026Private Property Market
A 42-Year-Old Block, a Fourth Attempt, and a New Law Worth Two Signatures
18 September 2026Private Property Market
The Cheapest PSF and the Cheapest Apartment Are Two Different Units

17 September 2026Private Property Market
Seven Developers Bid for the Same Site. The Winner Still Paid 11% More Than Anyone Else.

TRIBE Editorial · Reviewed by Silas Tan
Co-Founder, TRIBE · District Director, Huttons Asia · Ex-Mortgage Banker (AVP) · >1,000 families advised · CEA R000303I
This article is for informational purposes only and does not constitute financial or investment advice.