
Insights
Our Project Size Factor Promises Resale Turnover. In Freehold Stock It Runs Backwards.
Project Size is 16% of every score on TRIBE's resale scorecard, and it claims scale buys resale turnover. Across 2,010 condos and 117,319 caveats, turnover rises with size in leasehold stock and falls in freehold. Pooled, the correlation is +0.07.
By TRIBE Research · 29 October 2026 · 8 min read
Project Size carries 16% of every score on TRIBE's resale scorecard. It is the third-heaviest factor we publish, ahead of MRT Proximity, Tenure and Rental Yield. It also writes its own claim into the scorecard in plain text: a project in the top band is described as "ideal scale for liquidity and facilities without crowding. Typically the sweet spot for resale turnover."
That is a measurable claim, so we measured it. Across 2,010 scored condos and 117,319 resale and sub-sale caveats, the number of units in a project has almost no relationship with how often a unit in it changes hands. The rank correlation between unit count and turnover per unit is +0.07.
The flat line is not the interesting part. It is two opposite gradients cancelling each other out. In leasehold stock, turnover rises with project size, as the factor assumes. In freehold stock it falls. We apply one curve to both.
What the factor actually is
Project Size is a step function on unit count. Across all 2,350 scored condos it takes six distinct values, and the thresholds are sharp.
| Units | Factor score |
|---|---|
| Under 100 | 3 |
| 100–200 | 5 |
| 201–500 | 8 |
| 501–800 | 10 |
| 801–1,200 | 8 |
| 1,201–2,000 | 7 |
| Over 2,000 | 6 |
Two things follow from that table. The first is that the scale is not monotonic. It peaks at 501 to 800 units and then falls away, on the theory that very large projects suffer from internal competition. The 8 band is not even contiguous: a 300-unit project and a 1,100-unit project score the same.
The second is that most of the market never moves. 1,469 of 2,350 condos, or 62.5%, score 3 on this factor, because most private condos in Singapore have fewer than a hundred units. Add the 100-to-200 band and 75.5% of the board sits on one of two values. On a 16% weight the whole factor spans 1.12 points of the final ten-point score, from 0.48 to 1.60. Three-quarters of the board sits in the bottom 0.32 points of that range.
The thresholds also do real work at the edges. Meyer Mansion has 200 units and scores 5. The Pier @ Robertson has 201 and scores 8. One unit of difference is three points of factor, which is 0.48 points of final score. Botanique @ Bartley has 797 units and scores 10. Park Colonial has 805 and scores 8.
Before the honest part, the part that works
Scale does buy something, and it is worth stating before the criticism. It buys comparables.
| Units | Projects | Resales per year | Resales per 100 units per year |
|---|---|---|---|
| Under 100 | 1,246 | 1.3 | 3.51 |
| 100–200 | 262 | 4.8 | 3.51 |
| 201–500 | 304 | 11.4 | 3.44 |
| 501–800 | 157 | 26.7 | 4.59 |
| Over 800 | 41 | 45.9 | 4.66 |
The middle column rises almost perfectly with size. The rank correlation between unit count and absolute sales per year is +0.888. A seller in a 600-unit project prices against roughly 27 sales a year in the same development. A seller in a 40-unit project has one. That is a genuine difference in how a price gets set, and it is the strongest thing this factor has going for it.
Crossing the 200-unit line also tracks capital return. Using 60,256 matched repeat sales of the same unit across 1,934 projects, and holding district and purchase year still, projects of 201 to 500 units out-earned projects of 200 or fewer in 228 of 326 cells, by a median of 0.53 percentage points a year. That is not nothing on a factor that never claimed to predict return at all.
The claim it does make is about turnover, and that is where it breaks
The right-hand column of the table above is the factor's own metric, and it barely moves. Turnover runs 3.51, 3.51 and 3.44 across the first three bands, which the factor scores 3, 5 and 8. A five-point climb on a 16% weight buys no measurable change in how often a unit sells.
Inside the bottom band the spread is wider than the spread between bands. Among the 1,246 score-3 projects, turnover runs from 1.32 at the tenth percentile to 7.16 at the ninetieth. Projects five times apart on the thing being measured receive the same mark.
Then split by tenure, and the pooled flat line comes apart.
| Units | Freehold and 999-year | 99-year leasehold |
|---|---|---|
| Under 100 | 3.51 (n=1,188) | 3.95 (n=58) |
| 100–200 | 3.37 (n=204) | 4.00 (n=58) |
| 201–500 | 2.54 (n=120) | 4.15 (n=184) |
| 501–800 | 2.36 (n=14) | 4.71 (n=143) |
In leasehold stock the factor's assumption holds. Turnover climbs from 3.95 to 4.71 as projects get bigger. In freehold stock it goes the other way, from 3.51 down to 2.54 by the 201-to-500 band, where the factor has already awarded eight marks out of ten. The freehold 501-to-800 cell holds only 14 projects and should be read as a direction, not a figure.
The capital-return result splits on the same line. Over the 200-unit threshold, freehold projects win 138 of 174 district-and-vintage cells by a median of 0.82 points a year. Leasehold projects win 57 of 104, by 0.23. Over the 500-unit threshold, leasehold stock shows nothing at all: 150 of 310 cells and a median of −0.02 points a year.
So the two markets are close to mirror images. In freehold stock, scale costs turnover and pays in capital return. In leasehold stock, scale buys turnover and barely moves return. A single curve cannot describe both, and ours does not try.
Scale does not buy tighter pricing either
The other defence of a size factor is price discovery. More sales should mean a better-understood price, which should mean a narrower spread.
It does not. Measuring the coefficient of variation of PSF within each project, among same-bedroom sales in the same calendar year, dispersion is flat to slightly wider as projects grow: 4.2% under 100 units, 4.5% at 201 to 500, and 4.9% at 501 to 800, across the 952 projects with enough sales to measure it. The correlation between unit count and dispersion is +0.133, pointing the wrong way for the price-discovery story. Larger projects give a seller more comparables that agree slightly less.
The curve turns down where the market does not
Forty-six scored condos have more than 800 units. The factor marks 34 of them at 8, eleven at 7 and one at 6, all below the 501-to-800 peak, on the crowding theory. Their median turnover is 4.66 against 4.59 for the peak band, and their annualised repeat-sale return is 4.03% against 4.06%. On both measures the penalty describes a difference that is not there.
What this is worth, and what it is not
The honest summary is that Project Size is mislabelled rather than useless. The 200-unit threshold earns its place, for reasons the scorecard does not state. The comparables effect is real and mechanical. The turnover claim in the rationale text is not supported, the inverted shape above 800 units is not supported, and applying one curve to freehold and leasehold stock averages two opposite effects into a single misleading number.
Three limits worth naming. 340 of the 2,350 scored condos could not be matched to the transaction file and are excluded throughout. Turnover is measured over 2022 to September 2026 against total unit count, so a project whose owners mostly bought at launch and have not yet sold will look illiquid for reasons of age rather than scale. And repeat-sale returns are gross of stamp duty, agent fees and holding costs, so they measure price movement, not what a seller kept.
We publish our methodology so it can be checked, including by us. This is the fifth of these audits, after MRT Proximity, Tenure and Future Transformation, the Primary School Effect, Rental Yield and Project's Historical Performance. Each one changes what we would tell a seller, which is the only reason to run them.
Sources: TRIBE's published resale scorecard data (tribesg.com/rps-data-v2.json, 2,350 scored condos) and TRIBE's resale caveat dataset (117,319 resale and sub-sale caveats across 2,325 projects, derived from URA's private residential property transactions). Turnover measured 1 January 2022 to 30 September 2026. Repeat-sale returns use the 60,256 caveats carrying the seller's own purchase price and date, held at least one year. Figures as at 29 October 2026.
General information, not financial advice. Scorecard factors are one input among many and are revised as data improves. Confirm project details, tenure and transaction history with URA, your banker and your conveyancer before acting on any of it.
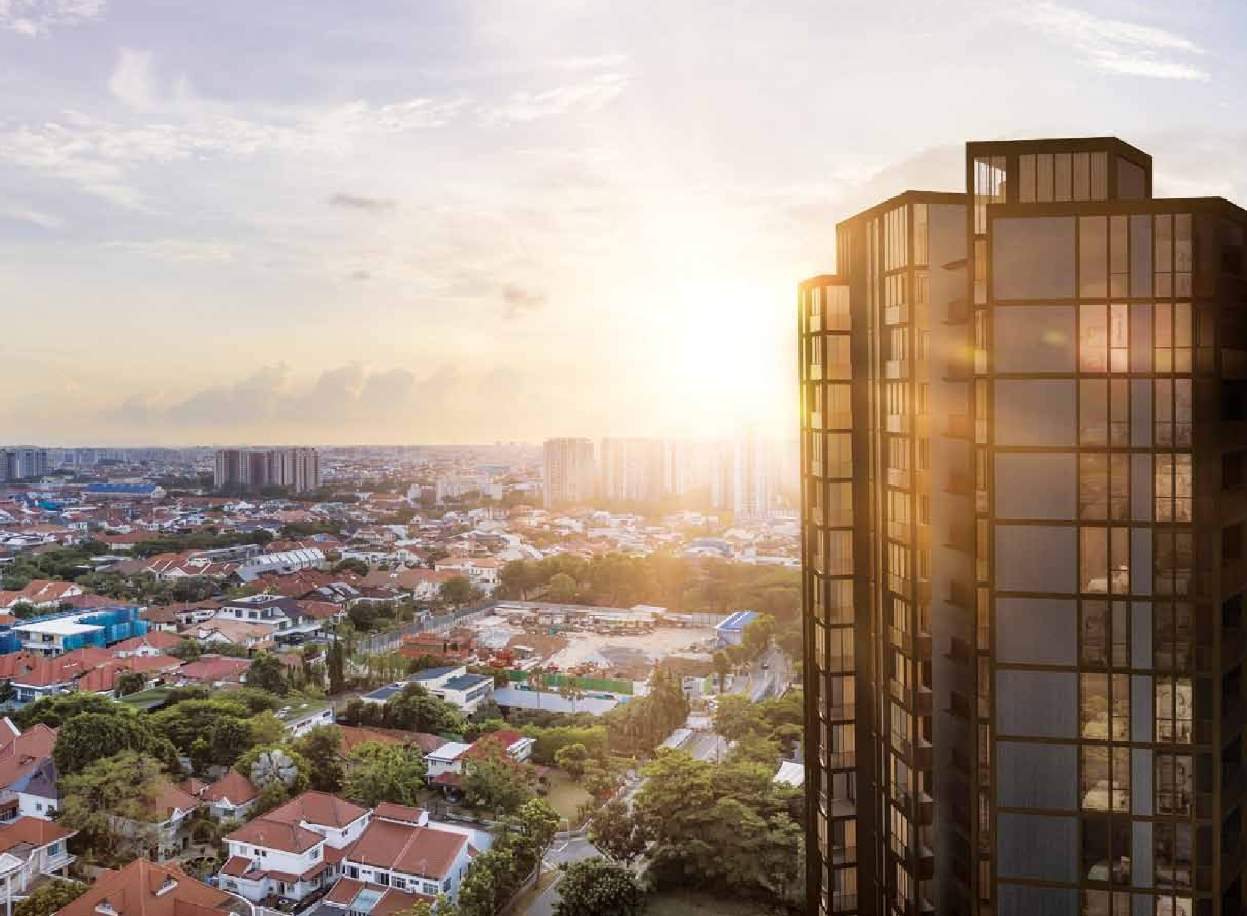
Condos in this article



Check how your condo scores
2,350 condos independently scored across 7 weighted factors. No registration required.
Score my resale →Prefer a personal read on your situation? Arrange a consultation →Keep reading
26 October 2026Private Property Market
Our Heaviest Factor Does Predict the Future. It Has One Working Threshold, Not Ten.
25 October 2026Private Property Market
Our Rental Yield Factor Measures Yield Correctly. Inside a District It Points the Wrong Way.

24 October 2026Private Property Market
Holding Longer Doesn't Raise Your Return. It Narrows the Spread by Two-Thirds.
Next step
TRIBE Research
Written with AI assistance from TRIBE's own data and the public sources listed, then checked against them. General information, not financial advice. How we write
How TRIBE scores and checks its analysis
Spotted an error, or a figure that has moved since publication? Tell us and we will correct it.
General information only, not financial, investment, legal or tax advice. It does not consider your own circumstances; check your own numbers before you commit.