Insights
We Audited All Seven Factors. The Score They Add Up To Is Weaker Than One of Them.
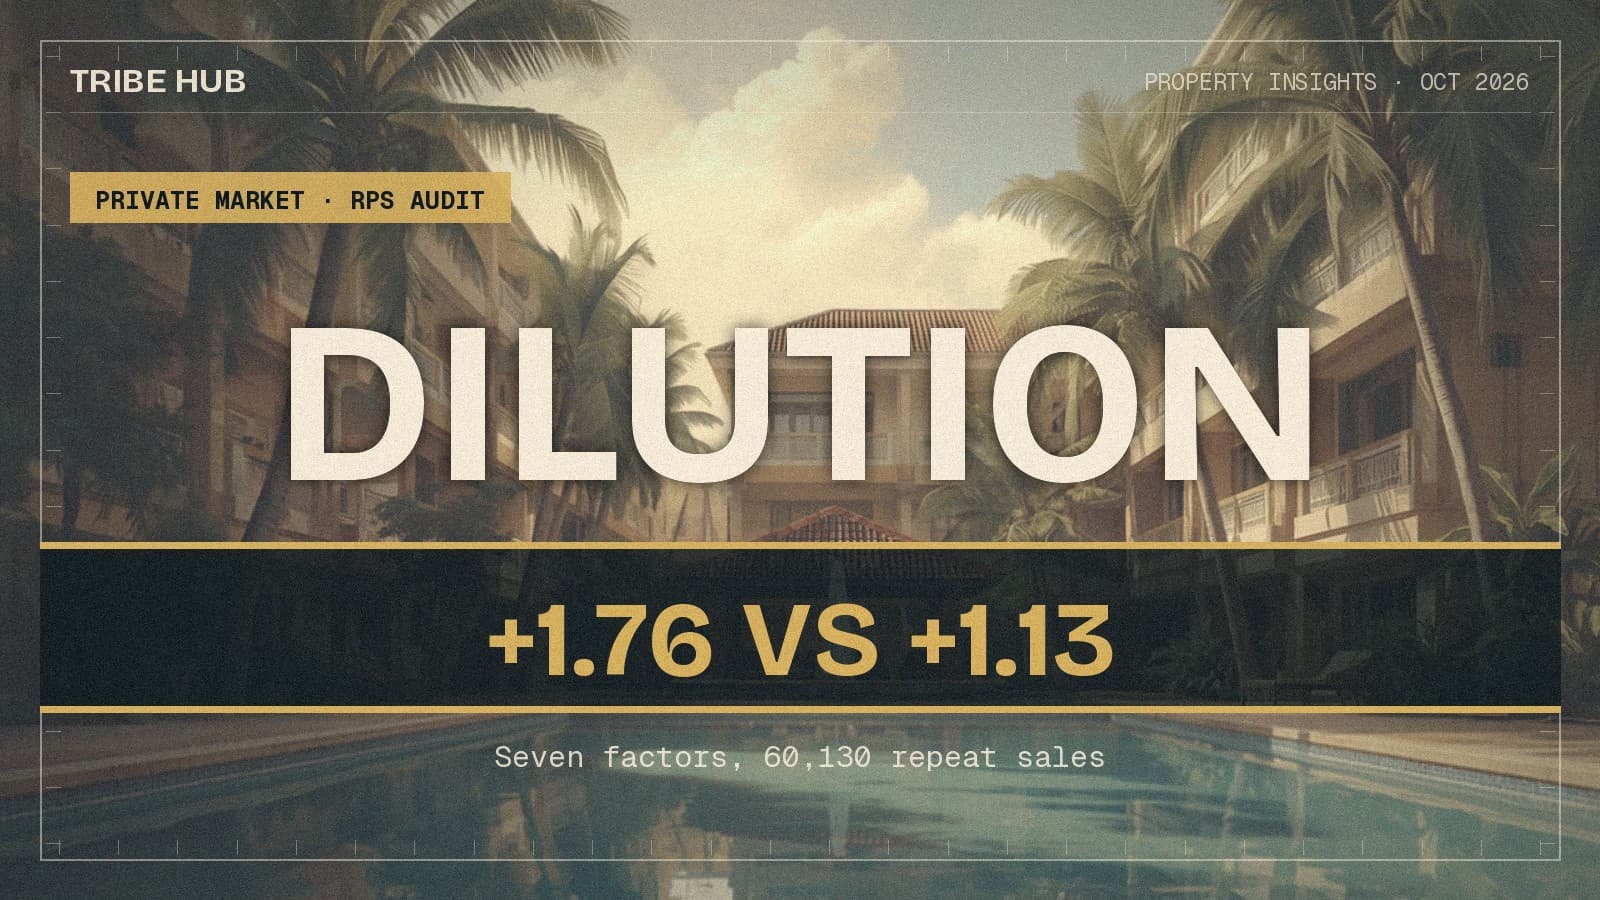
TRIBE's resale score blends seven factors. Across 60,130 repeat sales of the same unit, its heaviest factor used alone separates returns by 1.76 points a year. The full seven-factor score manages 1.13. The other 75% of the weight is dilution.
By TRIBE Research · 30 October 2026 · 9 min read
Over the past six weeks we have audited every factor on TRIBE's resale scorecard against the market it claims to describe. Seven factors, five articles, and a consistent pattern: most of them do less than their label promises.
This is the last one, and it asks the obvious remaining question. If each part is weaker than advertised, what about the whole? A seven-factor blend is supposed to be more than its inputs — errors cancel, signals reinforce.
Ours is not. Measured against 60,130 matched repeat sales of the same unit, the composite score separates high-return projects from low-return ones by 1.13 percentage points a year. Its heaviest single factor, used alone and ignoring the other six entirely, does 1.76. On the forward-looking test the gap is wider still: 1.51 against 0.47. We are adding six factors to a working signal and getting a worse answer.
What the score is
Every published resale score is a weighted average of seven marks out of ten.
| Factor | Weight |
|---|---|
| Project's Historical Performance | 25% |
| Primary School Effect | 20% |
| Project Size | 16% |
| MRT Proximity | 13% |
| Rental Yield | 10% |
| Tenure | 10% |
| Future Transformation | 6% |
That blend becomes a score from 2.46 to 9.35 across 2,350 condos, and the score becomes the grade a reader actually sees: S above 7.44, A from 6.55, B from 5.47, C from 4.67, D below that. 952 of the 2,350 are graded B.
Of those 2,350, 1,999 could be matched to our caveat file. They supply 60,130 repeat-sale pairs across 1,925 projects and 27 districts, bought between 1995 and 2025, held a median of 8.7 years.
First, the part that works
The grade ladder is real, and it is worth stating plainly before the criticism.
| Grade | Projects | Repeat-sale pairs | Median annualised return |
|---|---|---|---|
| S | 212 | 24,059 | 4.52% |
| A | 487 | 14,008 | 3.43% |
| B | 952 | 14,924 | 2.68% |
| C | 483 | 5,593 | 2.30% |
| D | 216 | 1,546 | 2.24% |
Monotonic, with a 2.3-point spread from top to bottom and a rank correlation of +0.402 between score and annualised return. That is a stronger relationship than any individual factor we have audited produced.
It also survives the controls that broke the individual factors. Grade S beats grade D in 43 of 51 district-and-purchase-year cells, by a median of 1.33 points a year, so it is not a regional artefact. In freehold stock alone, where no executive condominium can appear, the ladder is perfectly ordered: 4.47%, 3.44%, 2.57%, 2.25%, 2.04%. Strip out all 62 EC projects and the top-versus-bottom result holds.
Those controls matter here more than usual, because the top of our board is unusually concentrated. Not one grade-S repeat sale is in the Core Central Region, 69% are Outside Central Region, and 26% of grade-S pairs are executive condominiums against 0% of grade-D pairs. OCR returned 4.01% over the period against CCR's 2.06%. A pooled table alone would have been mostly a map.
So: the composite ranks capital return, and it does so for reasons that are not purely geographic. That is the honest version of the good news, and it is where most scoring methodologies would stop.
The test that matters is whether the whole beats the part
Project's Historical Performance is 25% of the score and it is a measured number: the scorecard writes the project's own past annualised return into its rationale text. So we can run the composite against that one factor, head to head, holding district and purchase year still each time.
| Panel | Composite, top vs bottom quartile | Historical Performance alone, 9–10 vs 0–4 | The other six factors, top vs bottom |
|---|---|---|---|
| All 60,130 pairs | +1.13 (154/204 cells) | +1.76 (189/212) | +0.23 (89/162) |
| Excluding all ECs | +0.95 (139/198) | +1.46 (169/195) | +0.03 (76/148) |
| Freehold only | +1.61 (92/106) | +2.50 (63/68) | +0.27 (50/87) |
| Bought 2021 or later | +0.47 (15/22) | +1.51 (30/33) | +0.67 (9/16) |
| Bought 2021+, ex-EC | +0.24 (13/22) | +1.10 (24/29) | −0.06 (7/15) |
| Bought 2021+, freehold | +0.40 (8/10) | +2.41 (9/10) | −0.29 (4/9) |
Six cuts, six times the same answer. The single factor beats the blend everywhere, and on the two cleanest cuts — freehold stock bought since 2021, where no EC can contaminate the sample and the return was earned after the scoring window closed — it beats it by six to one.
The fourth row deserves its own note, because it is the test that answers the circularity objection. If Historical Performance is past return, a correlation with return is almost tautological. So we restricted the panel to units bought in 2021 or later — 6,234 pairs across 1,067 projects, held a median of 3.7 years, earning their return after the window the factor was built from. The factor still wins 30 of 33 cells by 1.51 points a year. Past return genuinely persists. We are diluting a signal that works.
The other six factors, measured together
The right-hand column above is the six non-historical factors, reweighted to their own ten-point scale. Pooled across everything they are worth +0.23 points a year; excluding ECs, +0.03.
The sharper version holds Historical Performance still and asks what the other 75% of the weight adds inside a band of it, on the forward panel:
- Among projects scoring 0–4 on Historical Performance: +0.01 points a year (4 of 6 cells)
- Among those scoring 5–7: +0.07 (7 of 13)
- Among those scoring 8–10: +0.37 (3 of 4)
Three-quarters of the weight of the score, and within a band of the factor that works, it is indistinguishable from nothing. That is consistent with what the individual audits found one at a time — Rental Yield pointed the wrong way, Project Size reversed sign between tenures, MRT, Tenure and Future Transformation moved 29% of the weight and 1% of the difference — but it is the first time we have measured the cost of combining them.
And the ladder is not a ladder in the middle
The grade steps are also very unequal, and one of them points down.
| Step | All pairs | Bought 2021 or later |
|---|---|---|
| S vs A | +0.46 (173/266 cells) | +0.91 (25/40) |
| A vs B | +0.30 (215/344) | +0.15 (22/38) |
| B vs C | +0.15 (131/240) | −0.22 (12/27) |
| C vs D | +0.23 (43/73) | +0.23 (4/7) |
The ends of the scale separate. The middle does not, and on the forward panel a B-graded project earned slightly less than a C-graded one in the same district bought the same year. B and C together are 1,435 of 2,350 condos — 61% of the board sits in the stretch where the grade carries the least information.
The spread inside a grade swamps the step between grades. Among projects with at least five repeat sales, the tenth-to-ninetieth-percentile range of project median return is 3.1 points in grade S and 4.8 in grade C — against adjacent-grade steps of 0.15 to 0.46. 30% of grade-A projects out-earned the median grade-S project, as did 17% of grade B and 7% of grade D.
It was never a liquidity score, and it does not become one
One defence of a blended score is that it captures something other than return. Turnover is the obvious candidate, and it is not there: median resales per 100 units per year run 4.66 for grade S, then 3.67, 3.51, 3.59 and 3.01 — flat across the middle three grades, with a rank correlation of +0.109 between score and turnover, falling to +0.085 once ECs are removed.
One smaller thing, found while reconstructing the arithmetic. The score published for a project is not reproducible from the factor marks published alongside it: the marks are rounded to integers, so the weighted average of what you can see differs from the printed score for 1,700 of 2,350 condos, by up to 0.03 points. It changes no grade and no ranking, but a published methodology should be checkable to the last decimal, and this one is not.
What this is worth, and what it is not
The composite works at the ends and dilutes in the middle, and we would now rather tell a seller their Historical Performance mark than their grade. The six supporting factors describe real things about a project — a school within a kilometre, a station, a tenure — that buyers care about for reasons other than resale return. Scoring them is defensible. Giving them 75% of a number that gets read as a return forecast is not.
Four limits worth naming. 351 of the 2,350 scored condos could not be matched to the caveat file and are excluded throughout. Repeat-sale returns are gross of stamp duty, agent fees and holding costs, so they measure price movement rather than what a seller kept. The forward panel is small by design — 6,234 pairs and a median hold of 3.7 years — so its cell counts are thin and should be read as direction. And a project graded on seven factors is still being compared on one outcome; return is the outcome most readers mean, but it is not the only one a score could sensibly target.
This is the sixth and last of these audits, after MRT Proximity, Tenure and Future Transformation, the Primary School Effect, Rental Yield, Project's Historical Performance and Project Size. We publish the methodology so it can be checked, including by us. This one says the weights are wrong, which is a harder thing to publish than a factor note and a more useful one.
Sources: TRIBE's published resale scorecard data (tribesg.com/rps-data-v2.json, 2,350 scored condos, seven factors and weights per src/lib/rps-share.ts) and TRIBE's resale caveat dataset (117,319 resale and sub-sale caveats across 2,325 projects, derived from URA's private residential property transactions). Returns use the 60,130 caveats carrying the seller's own purchase price and date, held at least one year, annualised and winsorised at −50% and +80%. Turnover measured 1 January 2022 to 30 September 2026. Executive condominiums identified by URA property sub-type. Figures as at 30 October 2026.
General information, not financial advice. Scorecard factors are one input among many and are revised as data improves. Confirm project details, tenure and transaction history with URA, your banker and your conveyancer before acting on any of it.
Check how your condo scores
2,350 condos independently scored across 7 weighted factors. No registration required.
Score my resale →Prefer a personal read on your situation? Arrange a consultation →Keep reading
29 October 2026Private Property Market
Our Project Size Factor Promises Resale Turnover. In Freehold Stock It Runs Backwards.
26 October 2026Private Property Market
Our Heaviest Factor Does Predict the Future. It Has One Working Threshold, Not Ten.
25 October 2026Private Property Market
Our Rental Yield Factor Measures Yield Correctly. Inside a District It Points the Wrong Way.
Next step
TRIBE Research
Written with AI assistance from TRIBE's own data and the public sources listed, then checked against them. General information, not financial advice. How we write
How TRIBE scores and checks its analysis
Spotted an error, or a figure that has moved since publication? Tell us and we will correct it.
General information only, not financial, investment, legal or tax advice. It does not consider your own circumstances; check your own numbers before you commit.