Insights
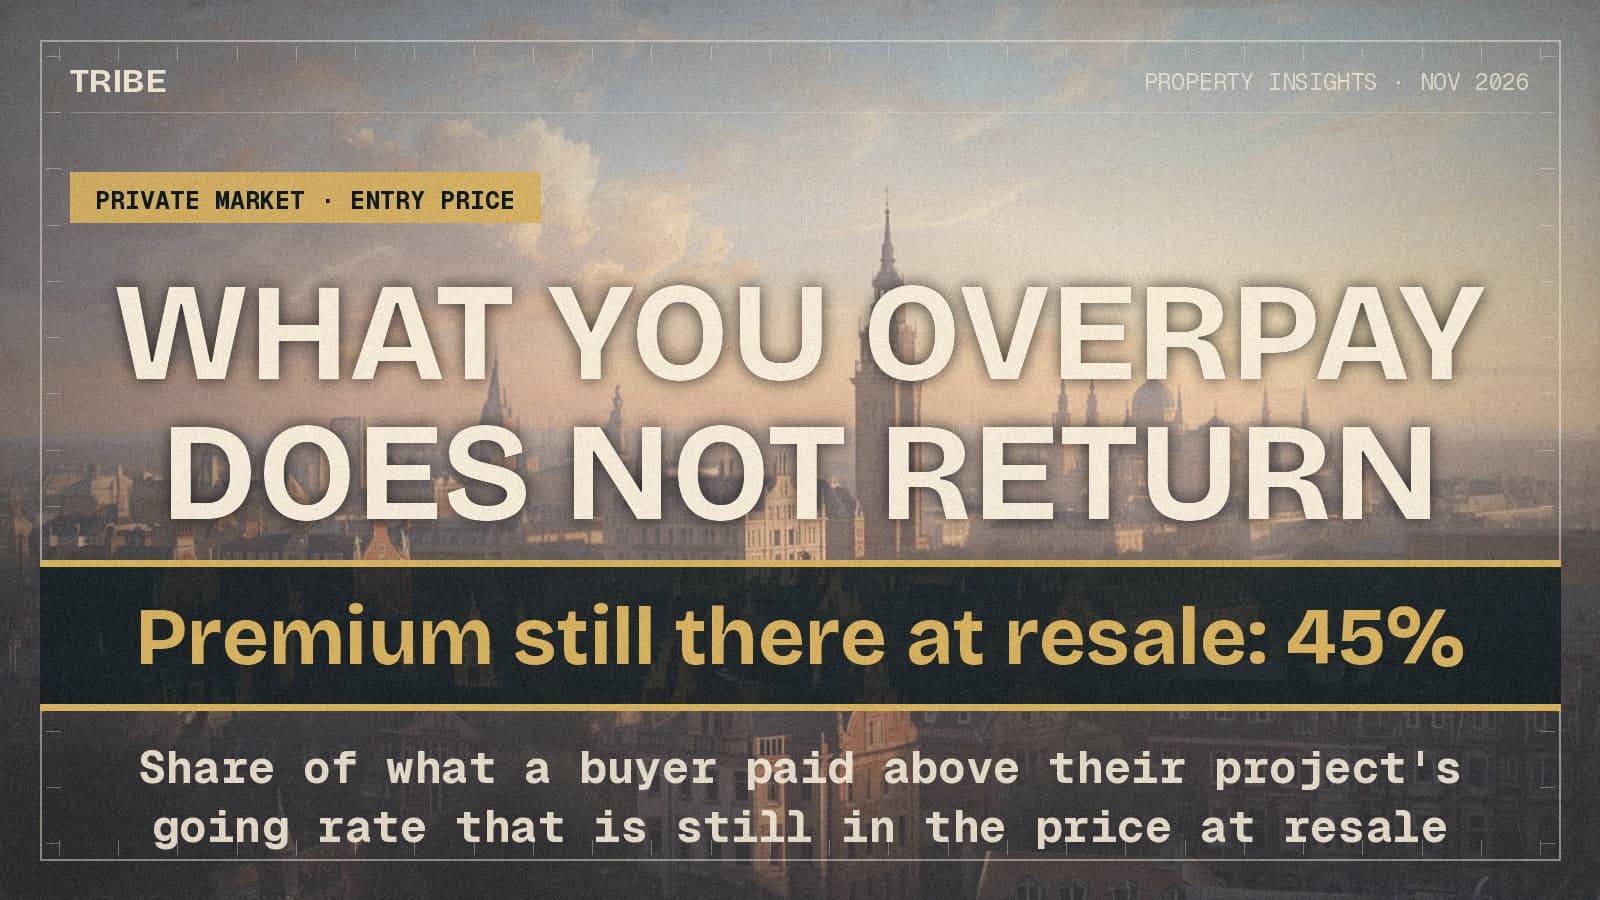
Less Than Half of an Entry Premium Comes Back. It Costs 0.69 Points a Year.
Across 41,212 same-unit resales in 609 condo projects, the dearest quarter of entry prices earned 3.23% a year against 3.92% for the cheapest, with floor, size and bedrooms held still. Only 45% of a premium paid at entry survives to resale.
By TRIBE Research · 3 November 2026 · 10 min read
The decision
- Who this is for
- Buyers negotiating one specific unit in a project they have already chosen, and owners pricing a unit before listing.
- The question
- Does the price I agree inside a project change my return, or does the project decide it for me?
- The short answer
- It changes it. Among buyers in the same project and the same purchase year, with floor, size and bedrooms held still, the cheapest quarter of entry prices earned a median 3.92% a year and the dearest 3.23%. That is 0.69 points a year. Only 45% of a premium paid above the project's going rate is still in the price at resale.
- Next step
- Before you sign, check what comparable units in that same project have transacted at this year, and price your offer against that rather than against the asking price.
The numbers behind it
- 0.69 points a yearMedian annual return gap between the cheapest and dearest quarter of entry prices
- 45%Share of a premium paid above a project's going rate still in the price at resale
- S$93,323Ten-year gap between the two entry quarters on a median S$988,598 purchase
A buyer who has settled on a project has one lever left, and it is worth more than it is usually given credit for. Across 41,212 same-unit resales in 609 private condominium projects, the quarter of buyers who paid least for their project and purchase year went on to earn a median 3.92% a year. The quarter who paid most earned 3.23%. The gap is 0.69 percentage points a year, and it holds with floor, unit size and bedroom count held still.
The reason is that a premium paid at entry does not stay in the price. Of every 10% paid above what a project was fetching that year, only 4.5% is still there when the unit is sold.
The question a buyer faces once the project is chosen
Most of the advice a private buyer meets is about choosing: which district, which project, new sale or resale, freehold or 99-year. All of it is spent before the only negotiation that is actually in front of them, which is the price of one unit in one project on one day.
The question is whether that negotiation matters, or whether the project and the year wash it out. It is a question that can be answered cleanly, because the same project and the same purchase year hold still almost everything else that drives a return: tenure, region, the stage of the market at entry, and the project's own quality.
The answer
It matters, and the size is measurable. Comparing buyers inside the same project who bought in the same year, the cheapest quarter of entry prices earned a median 3.92% a year and the dearest quarter 3.23%, a gap of 0.69 points a year. The two quarters were 7.7% apart on price at entry.
On the median purchase in this sample, S$988,598, that 7.7% is S$75,651. Carried at those two rates for ten years, the difference between the two positions is S$93,323. The cheaper entry does not merely save the discount. It compounds.
How much of a premium comes back
The mechanism is that a project's units converge on the project's own level. The clearest way to see it is to measure each unit twice: what it paid relative to its project in its purchase year, and what it fetched relative to the same project in its sale year.
Across 46,013 repeat sales in 753 projects, the relationship is close to one to two. Exit premium runs at 0.45 times entry premium. Of every 10% paid above the project's going rate, 4.5% is still there at resale.
| Paid vs the project that year | Still there at resale | Share recovered | Median return |
|---|---|---|---|
| More than 15% above | 4.6% above | 22% | 1.48% a year |
| 5% to 15% above | 1.9% above | 24% | 2.72% a year |
| Within 5% | level | n/a | 3.89% a year |
| 5% to 15% below | 2.7% below | 36% | 4.10% a year |
| More than 15% below | 11.7% below | 65% | 3.61% a year |
Two things in that table are worth reading carefully. The first is that overpaying is punished hardest at the top: the buyers who paid more than 15% above their project earned 1.48% a year. The second is that the deepest discounts were not the best outcome. The best returns came from the mildly cheap bucket, 5% to 15% below, not from the units bought more than 15% under. A very large discount usually signals something real about the unit rather than a bargain.
Why the raw quartile gap overstates it
Taken raw, the gap between the cheapest and dearest quarter of entry prices is 1.18 points a year, not 0.69. The raw figure cannot be used, because price per square foot inside a project is not a measure of how well someone negotiated. It is mostly a measure of what they bought.
Higher floors cost more per square foot. Smaller units cost more per square foot. A buyer in the dearest quarter is partly a buyer who chose a high-floor one-bedroom, and those units have their own return pattern. Any honest version of this test has to separate the unit from the price paid for it.
So within each project and purchase year, we model entry price per square foot on floor, strata area and bedroom count, and keep only the residual: what the buyer paid against what that specific unit should have cost in that project that year. Ranking on the residual rather than on raw price per square foot cuts the gap from 1.18 points to 0.69. Roughly four-tenths of the raw figure was the unit, not the deal.
The controlled comparison
On the controlled measure the cheapest quarter paid 3.7% below what their unit should have cost and the dearest paid 4.0% above. The direction is the same in every slice we can cut, which is the main reason to believe it is not an artefact of one market phase.
| Slice | Repeat sales | Gap, points a year |
|---|---|---|
| All | 41,212 | 0.69 |
| Core Central Region | 2,737 | 0.85 |
| Rest of Central Region | 12,560 | 0.78 |
| Outside Central Region | 25,915 | 0.63 |
| 99-year | 36,650 | 0.71 |
| Freehold | 3,882 | 0.47 |
| Held 1 to 5 years | 9,057 | 1.16 |
| Held 15 years or more | 3,318 | 0.47 |
| Bought 2020 to 2025 | 6,761 | 1.14 |
| Bought before 2010 | 3,563 | 0.48 |
It is also consistent project by project, which a pooled average can hide. In 1,311 of 1,548 project-year groups, or 84.7%, the cheapest quarter of entry prices beat the dearest. The median gap across those groups is 0.68 points, almost exactly the pooled figure.
The pattern across holding periods is what you would expect if this is an entry effect rather than a market effect. It is largest over one to five years, at 1.16 points, and smallest past fifteen years, at 0.47 points. Time does not erase the premium. It dilutes it, by spreading a fixed loss across more years.
Entry price is not the biggest lever a buyer has. Among 719 projects with at least 20 repeat sales, the middle half of projects span 2.13% to 4.22% a year, a range of 2.09 points. Project choice is worth about three times entry price. The difference is that project choice is spent by the time a buyer is at the table, and entry price is not.
What this does not prove
This does not prove that a buyer can negotiate their way to 0.69 points a year on demand. It measures what separated buyers who did pay less from buyers who did not, and some of what put them in the cheaper quarter was not skill. A motivated seller, a unit with a defect that does not appear in floor, area or bedroom count, an estate sale, a transfer between related parties: all of these land in the cheap quarter and carry their own reasons.
The pass-through figure of 45% is a floor, not a point estimate. A single recorded transaction carries noise, and noise in the entry price alone makes a premium look less persistent than it is. The true share that survives is higher than 45%, and the honest reading is that a meaningful part of a premium does not come back, not that exactly 55% of it vanishes.
Returns here are price to price on the same unit, annualised. They exclude rent received, financing and interest, buyer's and seller's stamp duties, maintenance fees, property tax, agent commission and renovation.
They are also measured only on units that actually resold between October 2021 and October 2026. Units still held, including those whose owners are unwilling to sell at a loss, are absent. That is survivorship, and it compresses the weak tail in every bucket. None of this is a law of the market. It is what 41,212 resales did over five years.
What this means for a buyer or a seller
For a buyer, the practical reading is that the going rate inside a project is a real number and worth finding before making an offer. The spread is not trivial: in a typical project and purchase year, the middle half of buyers paid a 7.7% range in price per square foot for the same project. Some of that is floor and size. The part that is not is the part this article is about.
It also changes what a high asking price means. A unit priced 10% above the project's recent transactions is not offering 10% more unit. On these numbers about 4.5 points of that come back and the rest is paid for out of the return. The buyers who paid more than 15% above their project were three times more likely to end up with a nominal loss than the cheapest quarter, 6.0% against 2.7%.
For a seller, the same arithmetic runs backwards and is worth knowing before setting a price. The market will not carry a premium that the project does not support, and a listing priced above what comparable units in the same project have transacted at is most likely buying time on the market rather than a higher price.
Next step
The number to establish before signing is not the asking price and not the district average. It is what comparable units in that same project have transacted at this year, with floor and size alongside. That is a check that takes minutes and it is the one input in this analysis a buyer still controls.
Send us the project, the stack and the price on the table and we will show you what has actually transacted in it, or run it yourself on the Resale Price Check.
Sample: 41,212 same-unit repeat sales of private condominium units, drawn from 68,581 such sales in 2,155 projects in TRIBE's own transaction dataset, with sales registered between 11 October 2021 and 4 October 2026 and purchases between 1995 and 2023. The controlled sample keeps project-and-purchase-year groups with at least eight repeat sales, giving 1,551 groups across 609 projects; the pass-through estimate uses 46,013 sales across 753 projects with at least five transactions at each end. Returns are price to price on the same unit, annualised, and exclude rent, financing and interest, stamp duties, maintenance fees, property tax, agent commission, renovation and all transaction costs. Entry price is modelled within each project-and-year group on floor, strata area and bedroom count. Executive condominiums, landed homes and HDB flats are excluded. This article is general information about market data and not advice on any particular property or transaction.
Your next step
Negotiating one unit in a project you have already chosen? Send us the project, the stack and the price on the table, and we will show you what comparable units there have transacted at this year.
A consultant replies on WhatsApp. No registration, no obligation.
Prefer a personal read on your situation? Arrange a consultation →Keep reading
2 November 2026Private Property Market
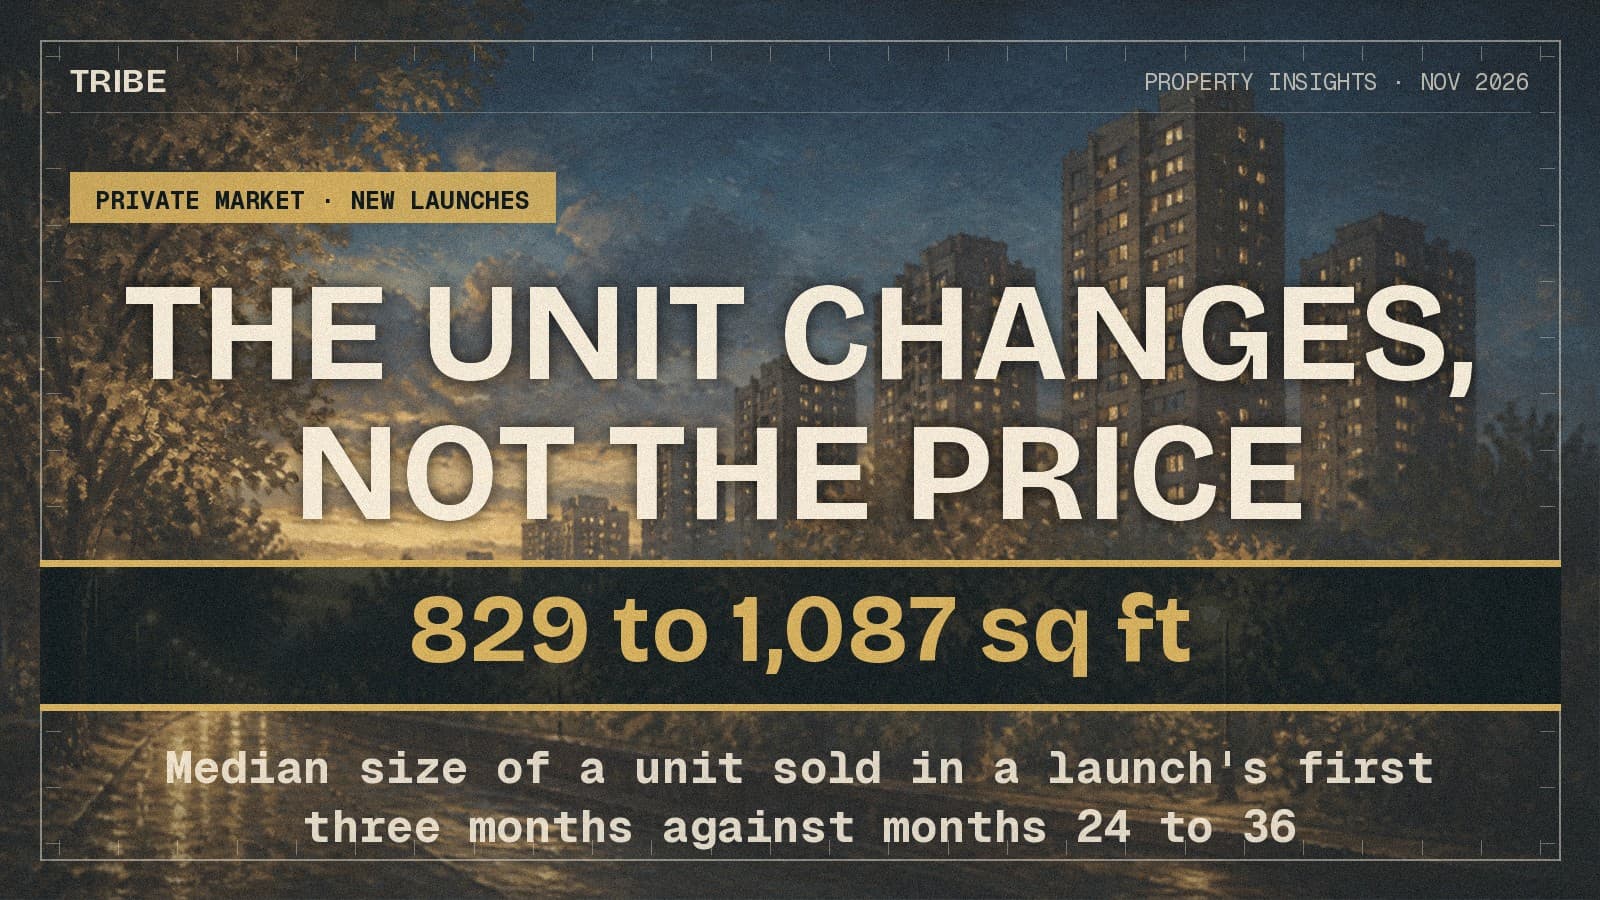
Waiting Out a Launch Changes the Unit More Than It Changes the Price
1 November 2026Private Property Market
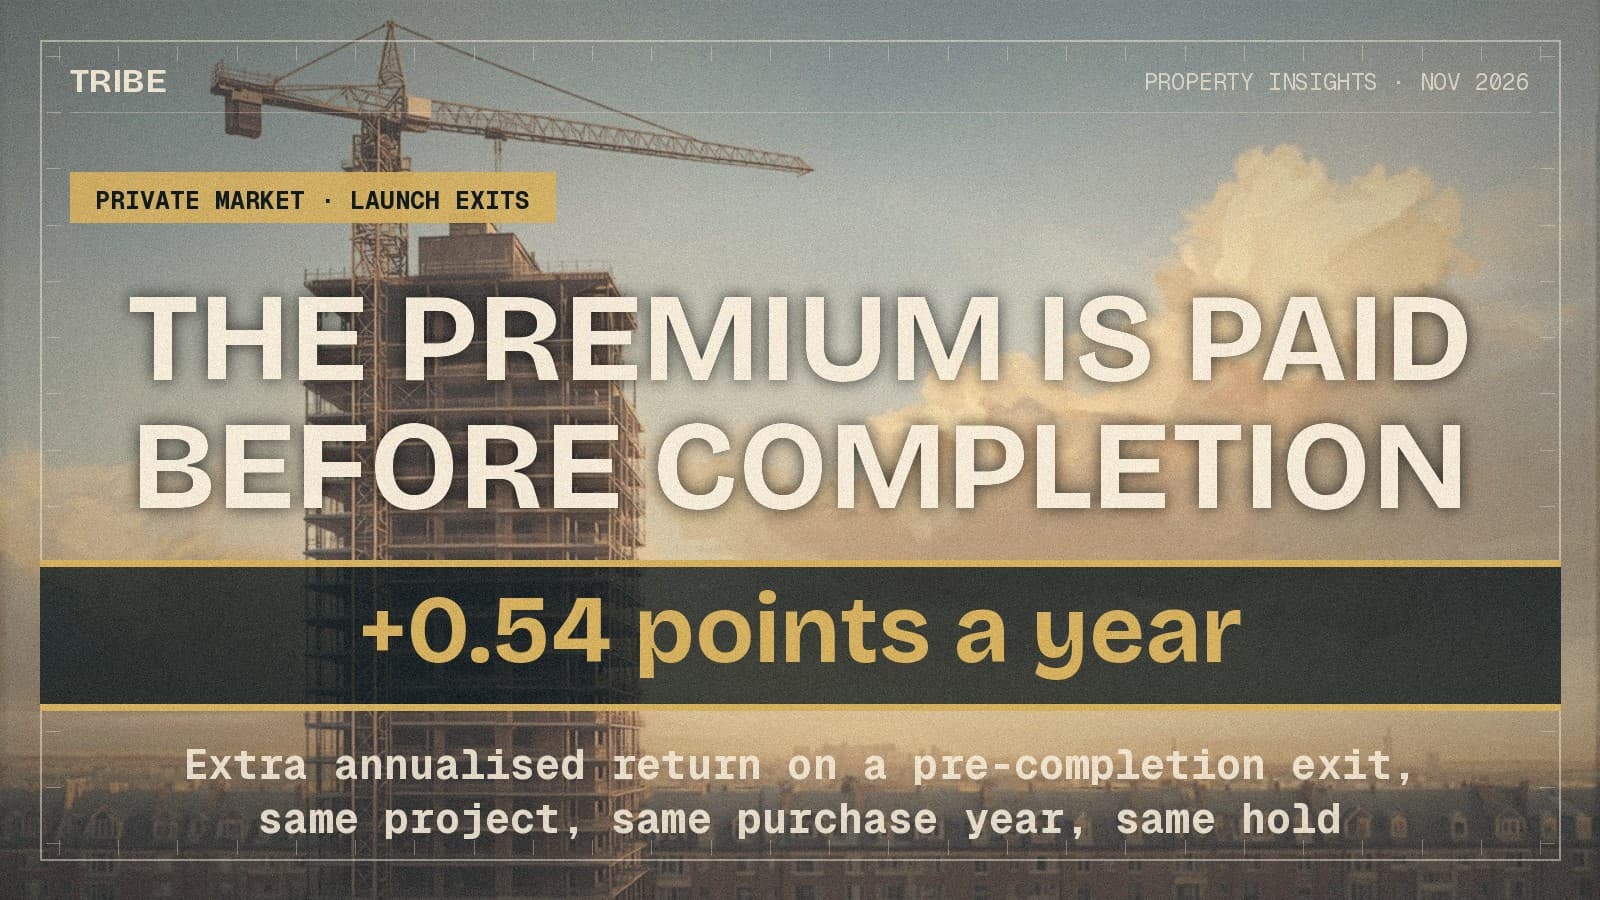
A Launch Sold Before Completion Earns Half a Point a Year More

31 October 2026Private Property Market
The School Catchment Is in the Price. It Is Not in the Tenants.
Next step
TRIBE Research
Written with AI assistance from TRIBE's own data and the public sources listed, then checked against them. General information, not financial advice. How we write
Data as of October 2026.
How TRIBE scores and checks its analysis
Spotted an error, or a figure that has moved since publication? Tell us and we will correct it.
General information only, not financial, investment, legal or tax advice. It does not consider your own circumstances; check your own numbers before you commit.