Insights
Waiting Out a Launch Changes the Unit More Than It Changes the Price
Across 38,613 developer sales at 132 condo launches, the median unit sold in months 24 to 36 was 31% larger and cost 46% more in total than one sold in the first three months. The price per square foot moved far less.
By TRIBE Research · 2 November 2026 · 7 min read
The decision
- Who this is for
- Buyers deciding whether to commit at a new launch's first weekend or wait.
- The question
- Does waiting cost me money at a new launch?
- The short answer
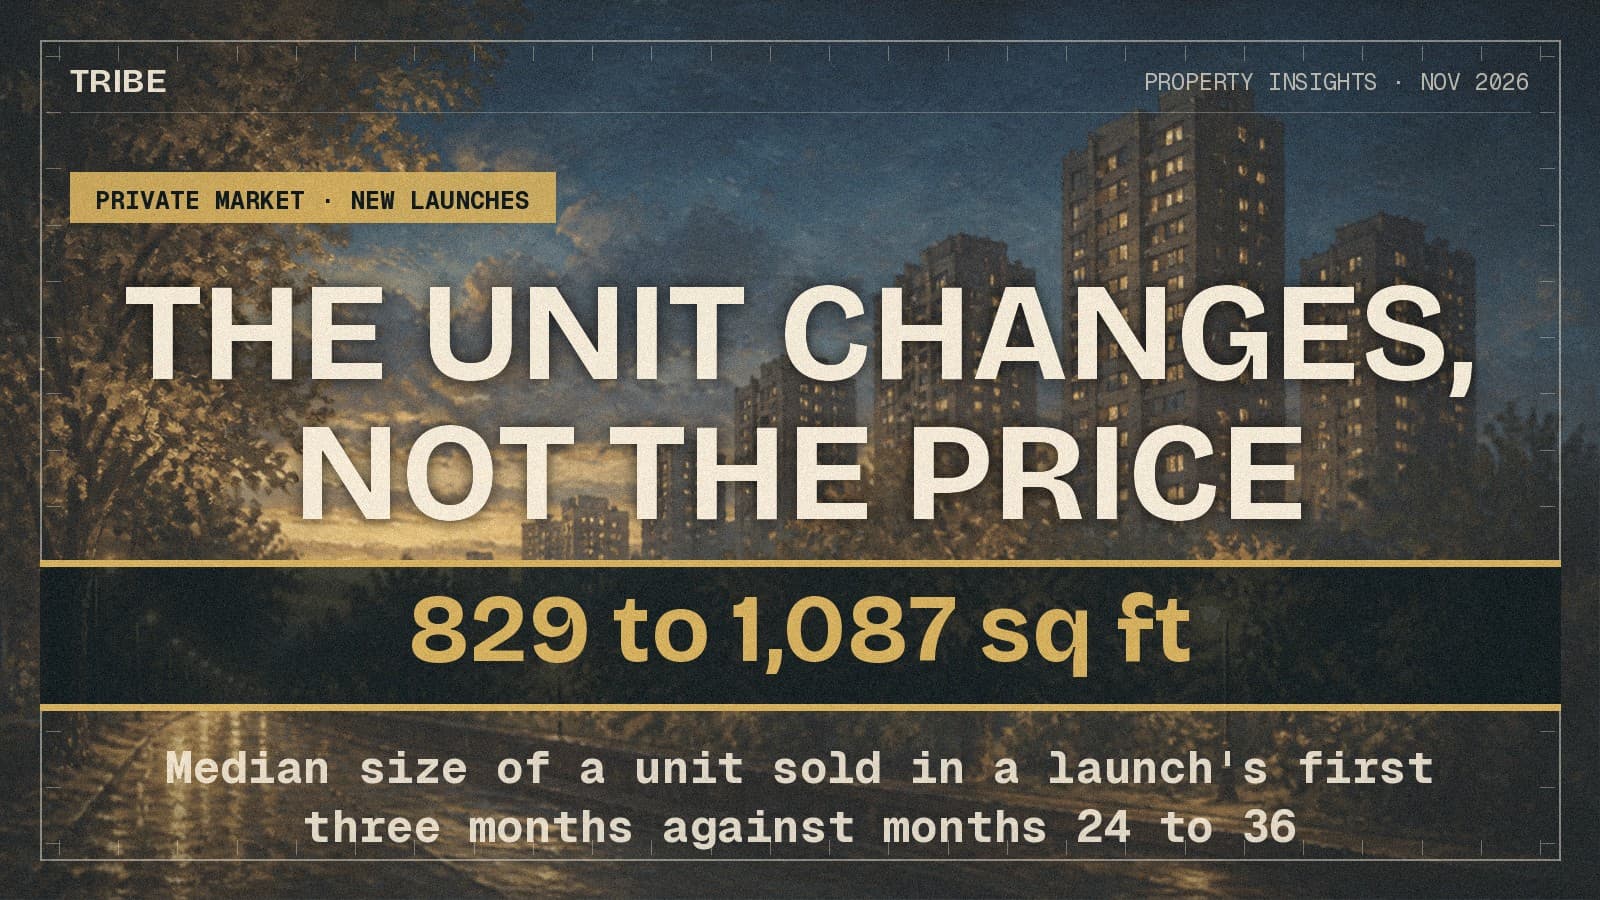
- Not reliably. Inside a launch the price per square foot rose about 1.5% a year, and once the market's own movement over the same months is netted out that figure cannot be told apart from zero. What does change is the stock: the median unit sold in months 24 to 36 was 1,087 square feet against 829 in the first three months.
- Next step
- Decide on the unit you want, then ask what is still unsold in that line, rather than buying early to beat a price rise.
The numbers behind it
- 829 to 1,087 sq ftMedian unit size sold in a launch's first three months against months 24 to 36
- +1.5% a yearPrice per square foot inside a launch, same project, controlling for floor and size
- 62%Share of a launch's first three years of sales that happen in its first three months
Every showflat runs on the same line: buy now, because the price list only goes up. It is a claim about the next twelve months of one project, and it is checkable. Across 38,613 sales made directly by developers in the first three years of 132 private condominium launches, the price per square foot inside a launch rose about 1.5% a year. Once the market's own movement over the same months is removed, that figure cannot be told apart from zero.
What does move, and moves a great deal, is the unit you are being shown. The median home sold in a launch's first three months was 829 square feet at $1,827,000. The median sold in months 24 to 36 of the same launches was 1,087 square feet at $2,667,500: 31% more space and 46% more money, on a price per square foot only 6.8% higher.
The question a launch buyer actually faces
The decision is usually framed as timing: commit on the first weekend at the opening price, or wait and risk paying more later. That framing assumes the thing being priced stays the same while the price moves.
It does not. A launch sells down, and what sells down first is not a random sample of the project.
The answer
Waiting rarely costs you a reliable amount per square foot. It almost always changes what is available to buy. A buyer who waits two years is not getting the same unit at a different price; they are choosing from a different, larger, more expensive remainder.
What the price per square foot actually did
Three specifications, each on the same 38,613 sales, each comparing units inside the same project:
| Specification | Price per square foot | 95% confidence interval |
|---|---|---|
| Project effects only | +1.46% a year | — |
| Plus floor, size and bedroom count | +1.54% a year | +0.93% to +2.16% |
| Plus calendar-month effects | +1.73% a year | −3.08% to +6.54% |
The second row is the honest headline number: comparing units of the same bedroom count, similar size and similar floor within the same project, the price per square foot rose 1.54% a year, with a t-statistic of 4.91.
The third row is the one that matters more. Adding calendar-month effects asks whether the rise is specific to the launch or simply the market rising underneath it. The point estimate barely changes, but the confidence interval opens from roughly one percentage point wide to nearly ten, and zero sits comfortably inside it.
Why the rise cannot be credited to the launch
The reason is structural, not statistical bad luck. Within a single project, months-since-launch and calendar time are almost the same variable — the median within-project correlation between them is 0.9989. A project that opened in October 2021 and sold through 2024 cannot tell you whether its price list rose because it was selling down or because Singapore's new-sale market rose 28% over those years.
Two further cuts say the same thing. Dropping the 61 projects that launched in 2021, which dominate the sample, leaves +1.15% a year on unit controls (t = 3.44) and −0.72% a year once calendar effects are added (t = −0.23) — the sign flips. Narrowing to units in the same stack of the same tower, where facing and layout are close to fixed, gives +1.93% a year (t = 6.06) on 21,631 sales across 1,515 stacks, and +0.51% (t = 0.30) with calendar effects.
Every specification agrees on the same thing: there is a rise, and this data cannot attribute it to the launch rather than to the market.
What does change: the stock
| Months since launch | Sales | Median size | Median price | Median psf |
|---|---|---|---|---|
| 0–3 | 23,955 | 829 sq ft | $1,827,000 | $2,372 |
| 3–6 | 3,287 | 947 sq ft | $1,850,000 | $2,140 |
| 6–12 | 4,831 | 969 sq ft | $2,091,400 | $2,424 |
| 12–24 | 5,132 | 1,033 sq ft | $2,343,000 | $2,575 |
| 24–36 | 1,408 | 1,087 sq ft | $2,667,500 | $2,534 |
Two-bedroom units are 38.0% of first-quarter sales and 18.0% of sales in months 24 to 36. Three-bedders go the other way, 35.6% to 45.7%, and units of four bedrooms or more rise from 15.3% to 25.6%. The small stock clears first.
This also explains the dip in the third row of the table above. Median price per square foot falls between months 0–3 and 3–6 not because the developer cut prices but because larger units, which carry lower rates per square foot, make up more of what sells.
Floor is not the story. Later buyers do sit slightly higher — about 1.3 storeys a year, t = 3.93 — but the median floor is the tenth in the first three months and the tenth again in months 24 to 36.
One more number frames all of this: 62.0% of a launch's first three years of developer sales happen in its first three months, and 70.6% in the first six. The "wait and see" window is small, and it is small because the project is mostly sold.
The spread between projects dwarfs the average
Fitting the same unit-controlled trend to each project separately, 109 of 132 launches saw the price per square foot rise and 23 fell. The median project ran at +2.50% a year, but the middle half spans +0.91% to +5.04%, and the extremes run from −10.36% a year at Jervois Mansion in D10 to +14.66% at Sengkang Grand Residences in D19. Arina East Residences (−9.74%), Lentor Central Residences (−6.61%) and Union Square Residences (−6.55%) also fell.
By region, the trend is strongest in the Outside Central Region at +2.66% a year (t = 7.89) and weakest in the Rest of Central Region at +0.98% (t = 1.92). Leasehold projects ran at +1.78% a year against +0.90% for freehold.
The average is a weak guide to any one launch. In roughly one project in six, the buyer who waited paid less per square foot.
What this does not prove
It does not prove developers never raise prices through a launch — they visibly do, and this data simply cannot separate that from the market moving. It does not measure unsold inventory: what remains later is inferred from what sold later, not from a stock list. Transacted prices carry no visibility of discounts, rebates or furniture vouchers, so a flat price list with rising incentives would read here as a flat market. And stack is a proxy for facing, not a measurement of it.
What this means for a buyer
Buying at a launch's first weekend buys choice, not a discount. The strongest argument for early commitment in this data is that the unit you want is far more likely to exist in month one than in month twenty — 62% of three years of sales clear in the first quarter, and the two-bedroom stock clears fastest of all.
The weakest argument is the one most often made. On the evidence here, a price list that rises 1.5% a year inside a launch is rising about as fast as the market around it, with a margin of error wide enough to include no rise at all.
Next step
Pick the unit, then test the timing. If the line you want still has stock, the case for waiting is a real one and the price risk is smaller than it is usually sold as. If it does not, the decision has already been made for you.
Sample: 38,613 transactions made directly by developers in the first 36 months of 132 private condominium projects, each with at least 40 such sales and a selling period of at least six months, from TRIBE's own transaction dataset covering October 2021 to 4 October 2026. Figures are price-to-price and exclude discounts, rebates, furniture vouchers, stamp duties and all transaction costs; "psf" is the transacted price divided by strata area. Standard errors are clustered by project. Executive condominiums, landed homes and resale or sub-sale transactions are excluded. This article is general information about market data and not advice on any particular property or transaction.
Condos in this article



Your next step
Weighing a launch unit against waiting for a later release in the same project? Send us the project and the unit type you are after, and we will show what has actually sold in that line and at what price.
A consultant replies on WhatsApp. No registration, no obligation.
Prefer a personal read on your situation? Arrange a consultation →Keep reading
1 November 2026Private Property Market
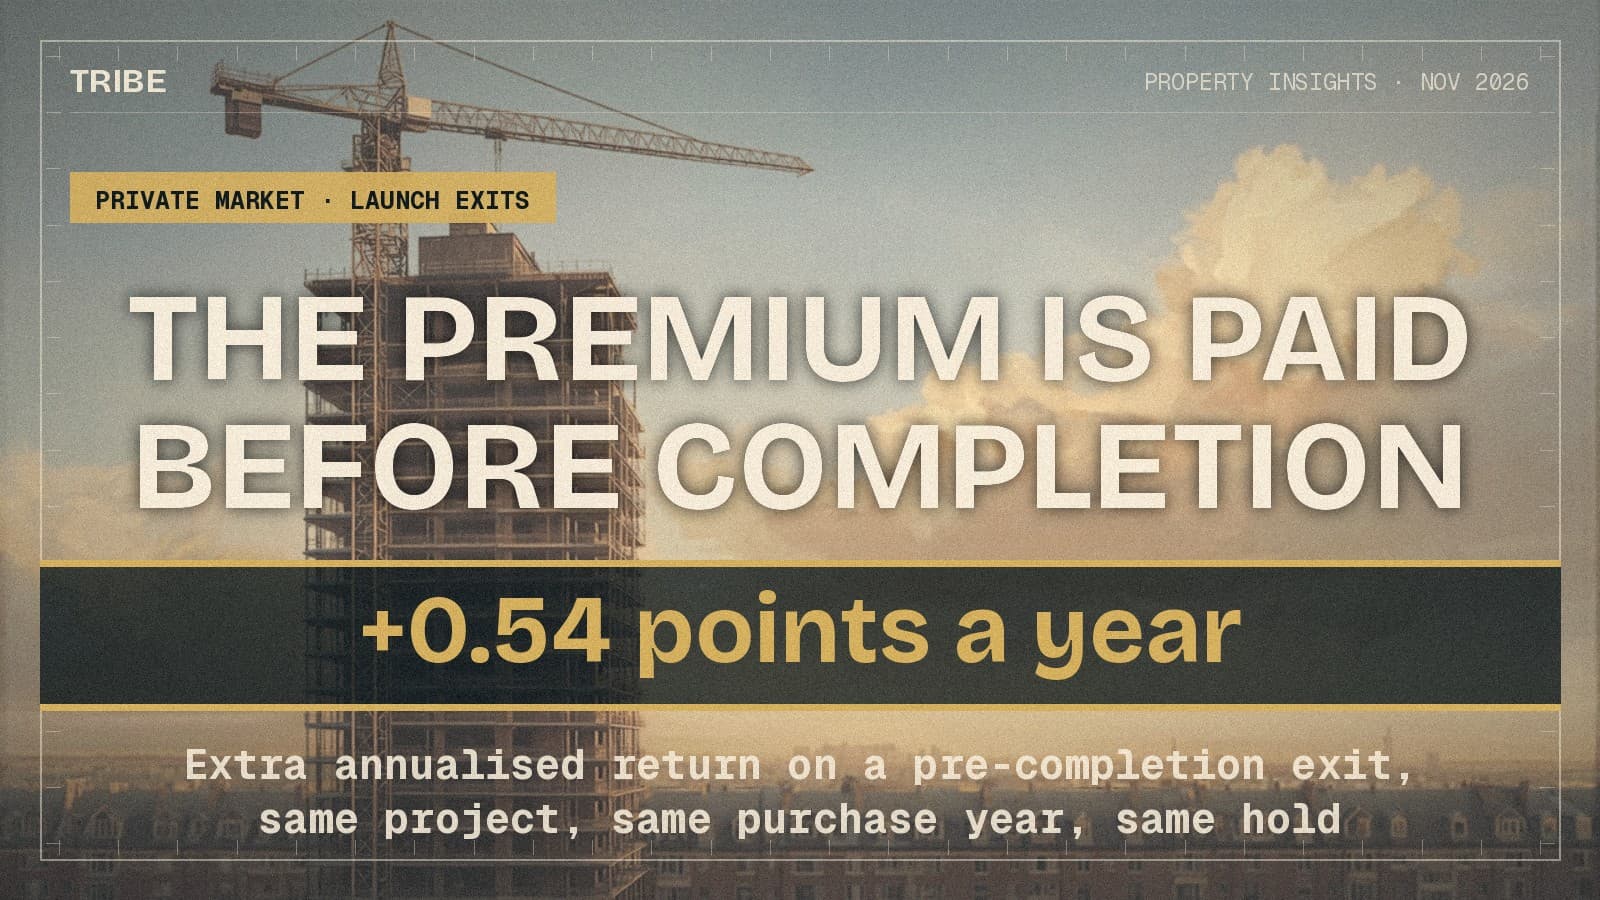
A Launch Sold Before Completion Earns Half a Point a Year More
31 October 2026Private Property Market
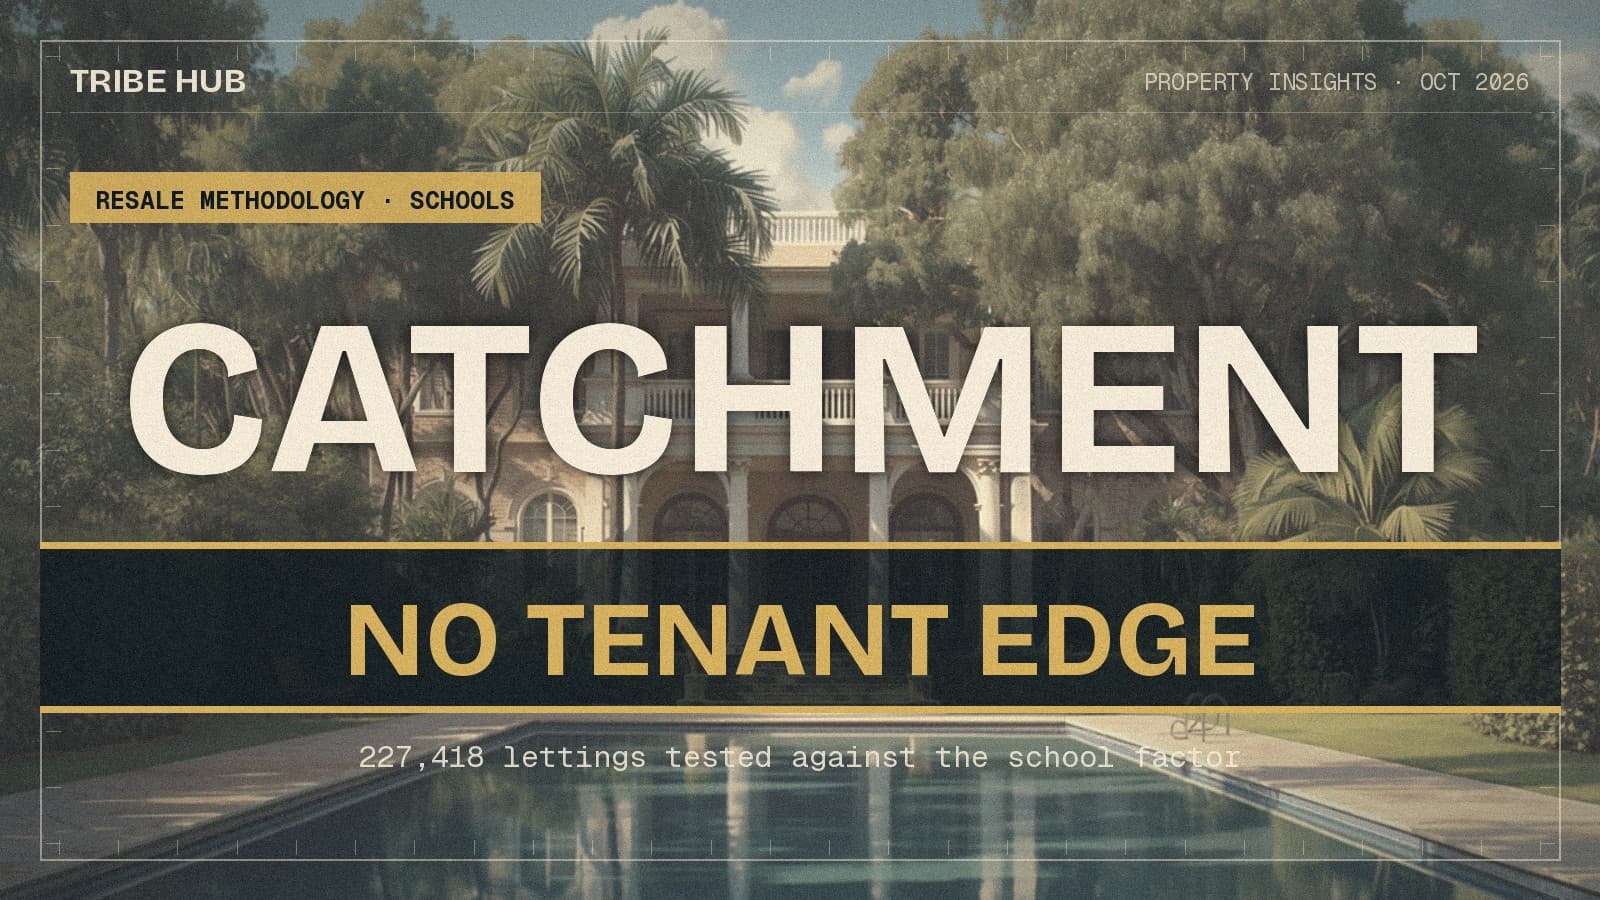
The School Catchment Is in the Price. It Is Not in the Tenants.
30 October 2026Private Property Market
We Audited All Seven Factors. The Score They Add Up To Is Weaker Than One of Them.
Next step
TRIBE Research
Written with AI assistance from TRIBE's own data and the public sources listed, then checked against them. General information, not financial advice. How we write
Data as of 4 October 2026.
How TRIBE scores and checks its analysis
Spotted an error, or a figure that has moved since publication? Tell us and we will correct it.
General information only, not financial, investment, legal or tax advice. It does not consider your own circumstances; check your own numbers before you commit.