Insights
A Condo Score Is an Average of Seven Things That Almost Never Agree
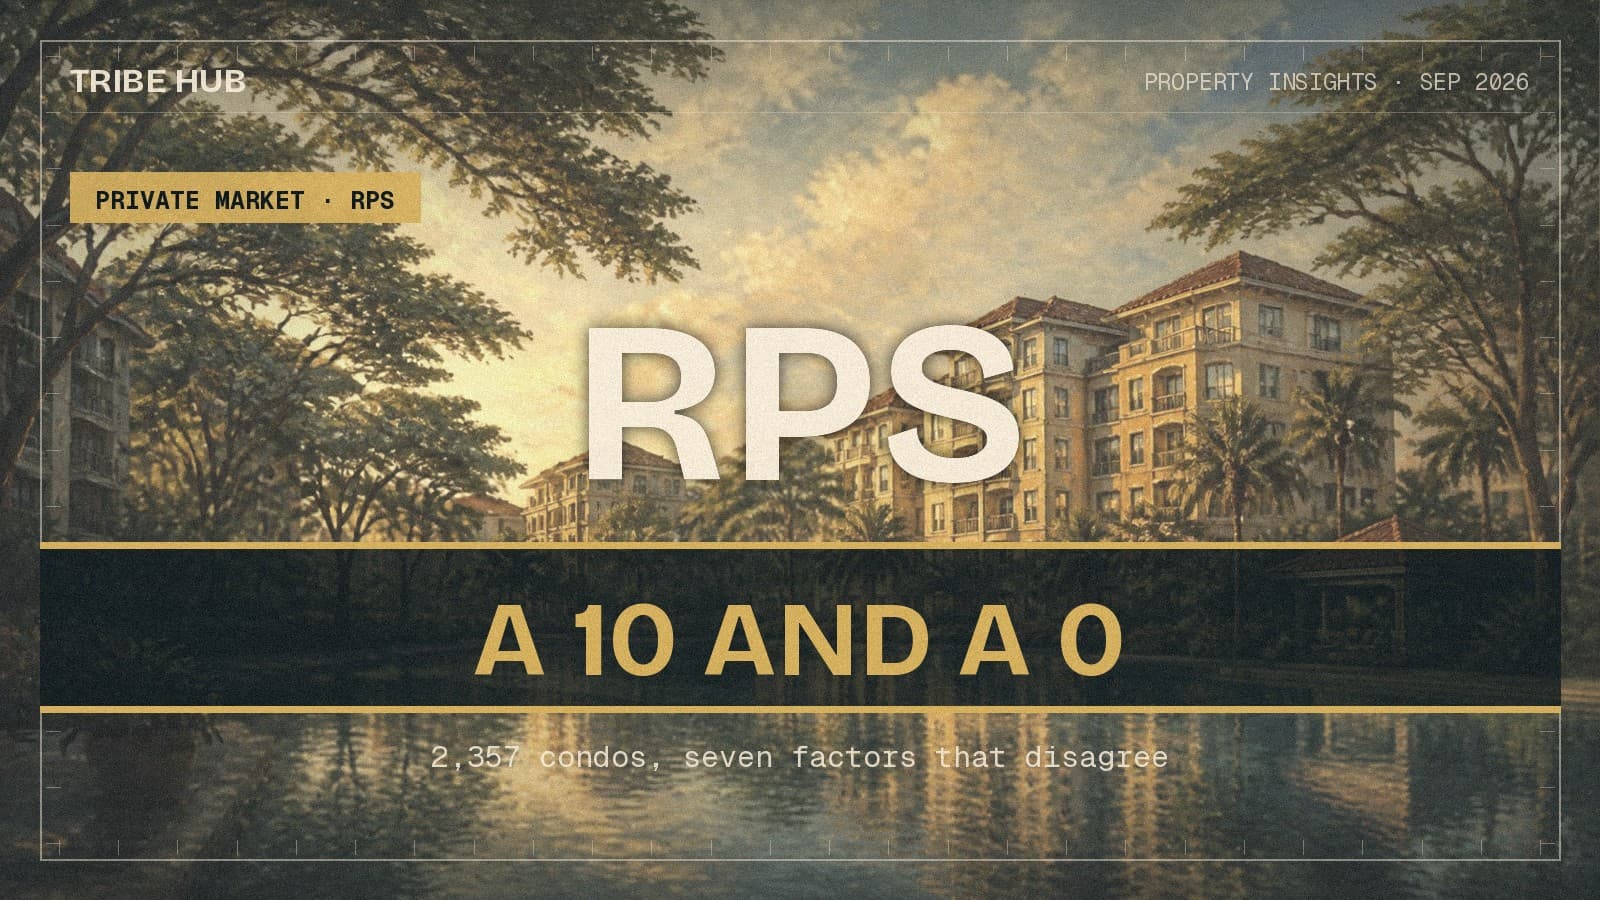
Ten of Singapore's 2,357 scored resale condos sit within three points of themselves across all seven factors. Fifty-eight per cent contain both a 10 and a score of two or below. The headline number hides more than it shows.
By TRIBE Editorial · 27 September 2026 · 9 min read
A single number is easy to act on. The Resale Project Scorecard gives every one of 2,357 scored resale condominiums one, from 0 to 10, and a letter grade beside it. Buyers use it the way they use a credit rating: higher is better, and a 6 is a middling sort of place.
A 6 is almost never a middling sort of place. It is usually a 10 and a 1 standing on each other's shoulders.
What the score is made of
The RPS is a weighted average of seven factors, each scored 0–10:
| Factor | Weight |
|---|---|
| Project's Historical Performance | 25% |
| Primary School Effect | 20% |
| Project Size | 16% |
| MRT Proximity | 13% |
| Rental Yield | 10% |
| Tenure | 10% |
| Future Transformation | 6% |
Before anything else, a check worth running on any published composite: multiply out the seven factors by those weights and compare the result to the score on the card. Across all 2,357 projects the reconstruction matches the published score to within 0.03 points, mean absolute difference 0.013. Nothing is hiding in the aggregation. Everything the score knows is in those seven columns — which means the columns can be read directly.
Almost nothing is consistent
For each project, take its highest factor and its lowest, and subtract.
| Spread (best − worst factor) | Projects | Share |
|---|---|---|
| 2 points | 1 | 0.0% |
| 3 | 9 | 0.4% |
| 4 | 40 | 1.7% |
| 5 | 77 | 3.3% |
| 6 | 144 | 6.1% |
| 7 | 673 | 28.6% |
| 8 | 655 | 27.8% |
| 9 | 502 | 21.3% |
| 10 (a 10 beside a 0) | 256 | 10.9% |
The mean spread is 7.83 points on a 10-point scale; the median is 8. Six projects in ten span eight points or more. Ten projects in the entire market — 0.4% — are within three points of themselves.
So the modal Singapore condo is not average at seven things. It is excellent at some and poor at others, and the score is the arithmetic that splits the difference.
Which card is the good one, and which is the bad one
The spread is not random across factors. Two of the seven do almost all the work at each end.
| Factor | Is the project's best card | Is its worst card | Market mean |
|---|---|---|---|
| Tenure | 79.7% | 0.9% | 9.31 |
| Primary School Effect | 20.7% | 19.1% | 6.40 |
| MRT Proximity | 14.2% | 3.9% | 7.58 |
| Project Size | 10.0% | 18.8% | 4.64 |
| Project's Historical Performance | 5.0% | 13.9% | 5.57 |
| Rental Yield | 1.2% | 30.3% | 4.25 |
| Future Transformation | 0.3% | 50.1% | 3.18 |
Shares exceed 100% because ties count for each factor holding the high or low.
Tenure is the best card in four projects out of five, at a market mean of 9.31. That is structural rather than flattering: a freehold project scores full marks, and a 99-year project with seventy-odd years left is not yet in trouble. It is the factor most likely to be a 10 and the factor least likely to tell you anything, because nearly everyone has it.
At the other end, future transformation is the worst card in half the market, mean 3.18. It measures proximity to confirmed URA Masterplan zones and new rail, and by construction most of Singapore is not next to the next thing being built. It carries the smallest weight, 6%, which is the sane treatment of a factor that is near-zero for most of the market.
Between them they explain the 256 full-spread projects almost completely. Of those, 233 have tenure as the 10 and 192 have future transformation as the low card. Their mean score is 5.70, a whisker below the national 5.946, and their grades run the whole way from 13 S-grades to 41 D-grades. A full 10-point internal spread is, by itself, not a verdict on a project at all.
Balance is what the top of the table actually looks like
Here is the finding that changes how the number should be read. Sort projects by grade and look at how internally consistent each band is.
| Grade | Projects | Mean score | Mean spread | Share with a full 10-point spread |
|---|---|---|---|---|
| S | 218 | 7.95 | 6.71 | 6.0% |
| A | 481 | 6.84 | 7.74 | 7.9% |
| B | 956 | 5.91 | 7.83 | 11.7% |
| C | 485 | 5.03 | 8.15 | 10.7% |
| D | 217 | 4.15 | 8.50 | 18.9% |
Spread falls monotonically as quality rises. D-grade projects are the most internally lopsided in the market and three times more likely than S-grade projects to hold a 10 beside a 0.
This is not a scoring artefact — a weighted average of seven numbers can reach 8 either by being 8 everywhere or by pairing 10s with 4s, and both routes exist. The data says the first route is how it actually happens. Of the top ten projects by score, seven have a spread of five points or less and a worst card of 4 or better. The way to a high RPS is to have no weak card, not to have one spectacular one.
The exceptions are instructive rather than fatal to the rule. Parc Life EC (8.92) and The Brownstone (8.91), both in D27, each carry a 2 and still finish near the top on the strength of the heavier factors. Brilliance can outrun a weakness. It usually doesn't.
Same score, opposite condos
The cleanest demonstration is two projects with the same number and nothing else in common. Across every pair in the dataset scoring within 0.03 of each other, the most dissimilar profile belongs to these two — both 6.10, both B grade:
| Factor | Varsity Park Condo (D5) | Pavilion Square (D14) |
|---|---|---|
| Project's Historical Performance | 10 | 3 |
| Primary School Effect | 1 | 9 |
| Project Size | 10 | 3 |
| MRT Proximity | 2 | 8 |
| Rental Yield | 5 | 10 |
| Tenure | 7 | 10 |
| Future Transformation | 6 | 0 |
| 530 units, 99YR, 2008 | 42 units, freehold, 2018 |
Their factor scores differ by 42 points in total out of a theoretical maximum of 70. One is a large leasehold project with a strong measured price record and no school catchment or station within useful reach. The other is a 42-unit freehold block near a station that rents well and has essentially no growth record to show.
They are not interchangeable and no sensible buyer is choosing between them. A family with a P1 registration coming is looking at one column; an investor pricing yield and hold cost is looking at the other. The score says they are equivalent. The score is answering a question neither buyer asked.
The ten that are consistent
For completeness, the projects that are within three points of themselves across all seven factors:
| Project | District | Score | Grade | Units | Completed |
|---|---|---|---|---|---|
| Wandervale | D23 | 9.22 | S | 534 | 2018 |
| Inz Residence | D23 | 9.01 | S | 497 | 2019 |
| Prive | D19 | 8.78 | S | 680 | 2013 |
| Grandeur Park Residences | D16 | 8.69 | S | 720 | 2020 |
| Piermont Grand | D19 | 8.64 | S | 820 | 2023 |
| Lake Grande | D22 | 8.60 | S | 710 | 2019 |
| Ecopolitan | D19 | 8.55 | S | 512 | 2016 |
| The Dew | D23 | 6.78 | A | 248 | 2003 |
| Hilltop Grove | D23 | 4.53 | D | 192 | 2001 |
| The Arcadia (Arcadia Gardens) | D11 | 4.51 | D | 164 | 1983 |
Seven of the ten are S-grade, and all seven are large 99-year suburban projects completed since 2013 in D16, D19, D22 and D23 — several of them former executive condominiums. That is a recognisable type: built out in a planned town with schools, a station and scale arriving together, so no single factor was left behind.
The last two are the other kind of consistency. Hilltop Grove and The Arcadia are small, old and unremarkable on every card at once, which is how a project posts a 3-point spread around 4.5.
How to use the number
The score is a ranking tool and it ranks honestly — the reconstruction check above says the weights are applied as published. What it cannot do is describe a project, because a weighted average of seven disagreeing numbers describes none of them.
Two habits follow. Read the spread before the score: a 6.1 with a 3-point spread is a genuinely average project, and a 6.1 with a 9-point spread is two different properties depending on which factor you need. Then read the columns you are actually buying. If the P1 ballot is the reason you are moving, the Primary School Effect score at 20% of the card is the number that matters, and a project that reaches your shortlist on tenure and size has not answered your question.
The average is not wrong. It is just not about you.
Figures computed from the published RPS dataset covering 2,357 scored resale condominiums, read on 27 September 2026. Factor weights as published on the RPS methodology. Sub-scores are integers 0–10; "spread" is the difference between a project's highest and lowest factor score.
Check how your condo scores
2,357 condos independently scored across 7 weighted factors. No registration required.
Score my resale →Prefer a personal read on your situation? Arrange a consultation →Keep reading

26 September 2026Private Property Market
The Developer League Table Is Mostly a Size Ranking
20 September 2026Private Property Market
The Rooms Coliwoo Owns Are Its Emptiest. That Is the Business Model, Not a Fault.

19 September 2026Private Property Market
A 42-Year-Old Block, a Fourth Attempt, and a New Law Worth Two Signatures

TRIBE Editorial · Reviewed by Silas Tan
Co-Founder, TRIBE · District Director, Huttons Asia · Ex-Mortgage Banker (AVP) · >1,000 families advised · CEA R000303I
How TRIBE scores and checks its analysis
Spotted an error, or a figure that has moved since publication? Tell us and we will correct it.
This article is for informational purposes only and does not constitute financial or investment advice.