Insights
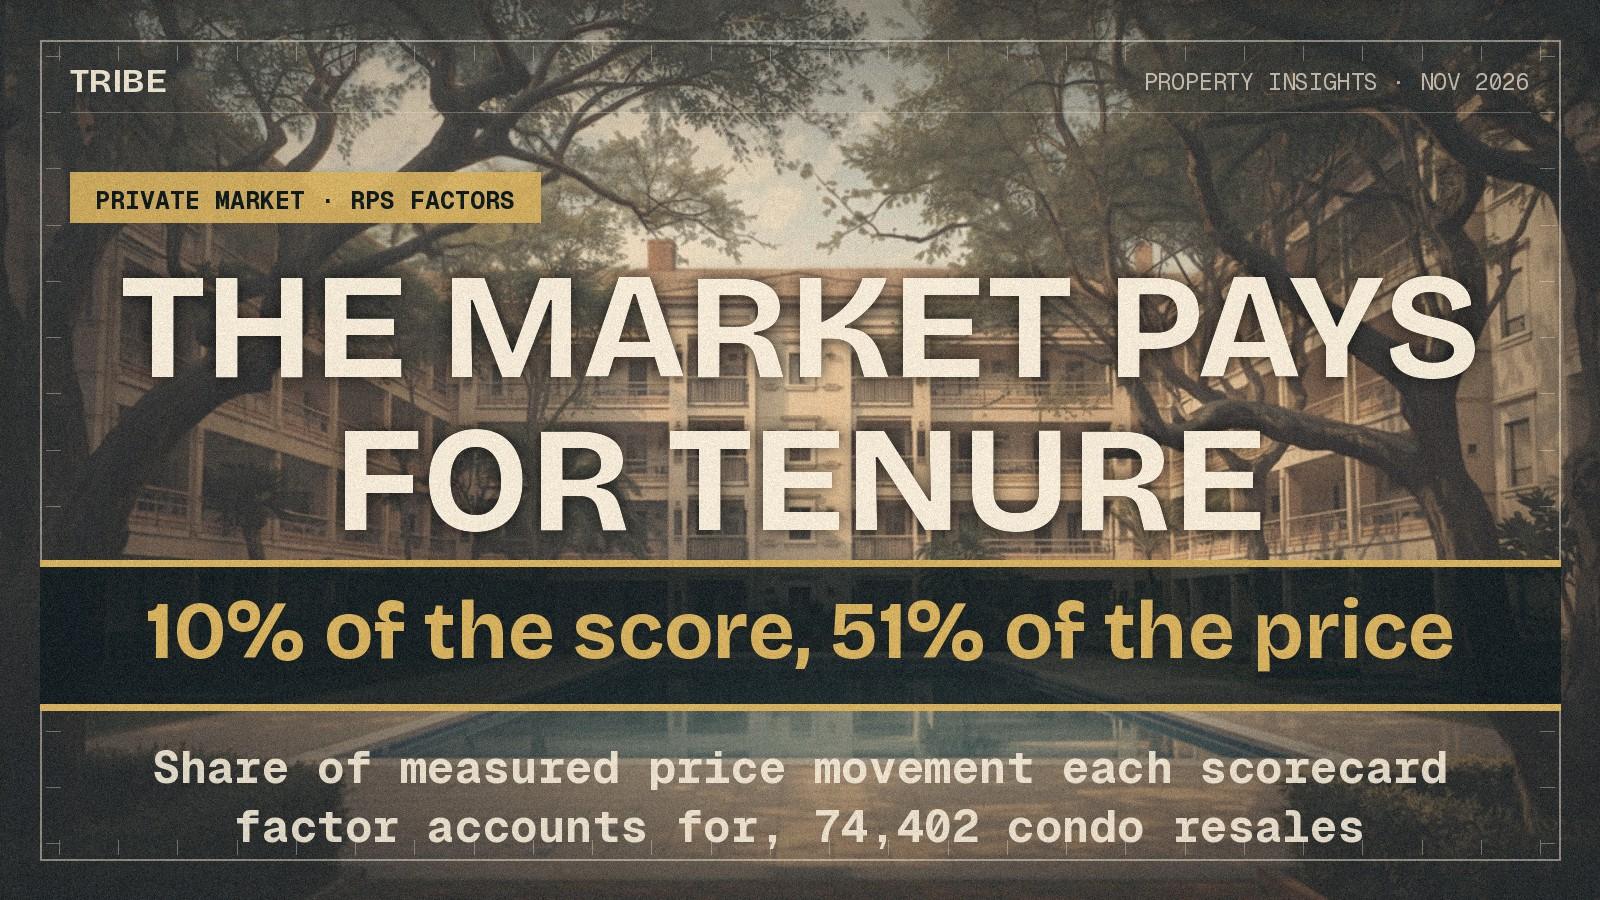
Tenure Is 10% of the Score and 51% of What the Market Pays
TRIBE reweighted the Resale Property Scorecard on 16 November. Across 74,402 condo resales in 1,996 scored projects, a point of Tenure adds 3.6% to price per square foot. A point of Historical Performance, now the heaviest factor at 30%, adds 0.4%.
By TRIBE Research · 17 November 2026 · 8 min read
The decision
- Who this is for
- Resale condo buyers comparing two projects with similar TRIBE grades.
- The question
- Which parts of a scorecard grade is the resale market actually charging for?
- The short answer
- Tenure and MRT proximity, mostly. Comparing sales in the same district, unit-size band, floor band, building age and half-year, a point of Tenure adds 3.6% per square foot and a point of MRT Proximity 2.2%. A point of Historical Performance adds 0.4%. Tenure carries 10% of the grade and 51% of the price.
- Next step
- Open the factor rows, not the grade. Two grade A projects can sit 26% apart on what the market charges for their factor mix, so check which factors earned the score before you price the difference.
The numbers behind it
- 3.6% a pointPrice added per point of Tenure score, same district and size band.
- 0.4% a pointPrice added per point of Historical Performance, the 30% factor.
- r = 0.02Correlation between a project's RPS score and what its factor mix commands.
TRIBE's Resale Property Scorecard was reweighted on 16 November 2026. Historical Performance went from 25% of the score to 30%, Primary School Effect from 20% to 15%, MRT Proximity from 13% to 15%. Every grade was recalculated on the new weights.
A separate question is what the resale market charges for each of those seven factors. Across 74,402 condo resales and sub-sales between October 2021 and October 2026, in 1,996 scored projects, a point of Tenure is worth 3.6% per square foot. A point of Historical Performance, now the heaviest factor at 30%, is worth 0.4%.
The scorecard weights what an owner should care about. The price data says what a buyer is being charged for. Those are different lists, and the gap between them is where a buyer has room to argue.
The question a buyer is actually asking
Two resale condos, same part of town, similar size. One scores 8.4 on the TRIBE scorecard, the other 8.3. The grades say they are close. The asking prices are not.
A grade is a weighted sum of seven project-level scores, each marked out of 10. It does not say which of the seven the market is willing to pay for. That is answerable from transaction data, and the answer is lopsided.
The answer in plain language
Tenure and MRT proximity are what the resale market charges for. Very little else carries a price.
Compare sales in the same district, the same unit-size band, the same floor band, the same building age and the same half-year of sale. Each extra point of Tenure score adds 3.6% to price per square foot. Each extra point of MRT Proximity adds 2.2%. On the median transaction in this sample, $1,550,000, that is about $56,000 and $35,000.
Primary School Effect, which carried 20% of the score until last week and 15% now, adds nothing measurable: −0.2% a point, too small and too uncertain to separate from zero.
What a point of each factor is worth
| Factor | Weight to 15 Nov | Weight from 16 Nov | Price per extra point | t |
|---|---|---|---|---|
| Tenure | 10% | 10% | +3.6% | 10.6 |
| MRT Proximity | 13% | 15% | +2.2% | 8.5 |
| Project Size | 16% | 15% | +0.8% | 4.6 |
| Historical Performance | 25% | 30% | +0.4% | 2.2 |
| Primary School Effect | 20% | 15% | −0.2% | −1.6 |
| Future Transformation | 6% | 5% | −1.1% | −4.4 |
| Rental Yield | 10% | 10% | −1.7% | −5.6 |
The last column is the t-statistic. Above about 2, the figure is unlikely to be noise. The result holds when district and half-year of sale are combined into a single control, when sub-sales are dropped, and in each of the three market regions separately.
Two of the negatives are not what they look like. Rental Yield is gross rent divided by price, so a high score is partly a statement that the project is cheap for the rent it earns. That coefficient is arithmetic, not a market judgement.
Future Transformation scores closeness to Master Plan zones and MRT lines that have not opened yet. Those sit disproportionately in areas that are cheaper today. In the Core Central Region the sign flips to +2.2%, which fits: there, a catalyst is an addition to an already expensive address.
Why the grade itself does not tell you the price
Across the 1,509 scored projects with at least five sales in the window, the correlation between the RPS score and median price per square foot is −0.20. Higher-scoring projects are, if anything, slightly cheaper per square foot. Within a single district the sign reverses, and the median correlation across 18 districts is +0.22, which is weak.
Now combine the price effects above into one number per project: what the market pays for that project's particular mix of seven scores. The correlation between that number and the RPS score is 0.02. Essentially none.
An earlier audit found that MRT Proximity, Tenure and Future Transformation carry 30% of the weight between them and explain almost none of the spread between one project's score and another's. Two of those three are what the market charges for. The factors that barely move a TRIBE grade are the ones that move the price.
That is the scorecard behaving as designed. It scores the project, not the asking price, and the methodology page says so plainly. But it means a grade cannot be read as a valuation. Among the 165 grade A projects in this sample, the market-paid value of the factor mix spans 26% between the 10th and the 90th percentile. Two A grades can be built from factor rows the market prices 26% apart.
What the 16 November reweighting did
Rank the seven factors by how much of the measured price movement each one accounts for and the order is Tenure 51%, MRT Proximity 31%, Project Size 12%, Historical Performance 6%, and nothing for the other three.
The reweighting moved two factors in the direction the price data supports. MRT Proximity went up, from 13% to 15%. Primary School Effect came down, from 20% to 15%. It moved Historical Performance the other way, from 25% to 30%, and that is the factor the market pays least for in price terms.
That is not necessarily wrong. The methodology page states that the scorecard is not a return forecast, and that the seven-factor composite separated later resale returns less clearly than Historical Performance alone. Price level today and return later are different questions. The narrower point for a buyer stands either way: the heaviest factor in the grade is close to free in current prices, and the factor you do pay for carries 10% of the grade.
What the analysis does not prove
The factor scores are a single reading taken on 17 November 2026 and applied to sales going back to October 2021. Remaining lease shortens, MRT lines open, and the scorecard moves those scores over time. Over a five-year window that blurs the measurement, and it works against finding an effect rather than inventing one.
These are price levels, not returns. A factor the market does not pay for today may still be the one that holds value later. This article does not test that. Our audit of all seven factors asks the returns question instead, and answers it less kindly.
The figures are correlations inside matched comparisons, not causation. Tenure correlates with freehold status, which correlates with older and more central stock. District, building age, unit size, floor and half-year of sale are controlled. Plot ratio, renovation and view are not.
1,996 of the 2,325 projects in the transaction dataset matched a scored project by name and carried a completion year. The 329 that did not are mostly very new launches and executive condominiums.
Primary School Effect is nil islandwide but not everywhere: +0.5% a point in the Outside Central Region against −2.0% in the Core Central Region. "Nothing" is the honest islandwide reading, not a local rule.
What it means for a buyer
If you are being asked to pay for a project's school catchment, the resale market has not been paying for it. That premium is one you would need to recover from a buyer who prices schools the way this seller does. The primary-school premium has the same result from a different direction.
If you are choosing between two similar grades, the one whose points come from Tenure and MRT carries the market's money. The one whose points come from schools, future catalysts and headline rental yield is the cheaper way to own a well-scored project. The question is then whether you expect that to change.
If you are selling, your strongest sub-scores are not equally sellable. Lease remaining and distance to an MRT station are the two a buyer has actually paid for. Where lease decay starts to bite puts a number on the first of those by building age.
Next step
Comparing two resale condos with similar grades? Send us both projects and the unit sizes you are looking at. We will show which factors earned each score, and what the resale market has paid for that mix in your district. Resale Price Check runs the same lookup for a single project, and all seven weights are published on the methodology page.
Based on 74,402 private condominium resales and sub-sales between October 2021 and October 2026 across 1,996 scored projects, from TRIBE's transaction dataset joined by project name to the TRIBE Resale Property Scorecard, read on 17 November 2026. Price effects come from one regression of log price per square foot on the seven factor scores, with district, half-year of sale, unit size, floor and building age controlled and standard errors grouped by project. Figures are price per square foot before stamp duties, agent fees and legal costs, and exclude rent, maintenance and loan costs. Factor weights are those published on the methodology page, revised 16 November 2026. General information, not advice on any particular property or household.
Your next step
Comparing two resale condos with similar grades? Send us both projects and the unit sizes. We will show which factors earned each score and what the resale market has paid for that mix in your district.
A consultant replies on WhatsApp. No registration, no obligation.
Prefer a personal read on your situation? Arrange a consultation →Keep reading
21 November 2026Private Property Market
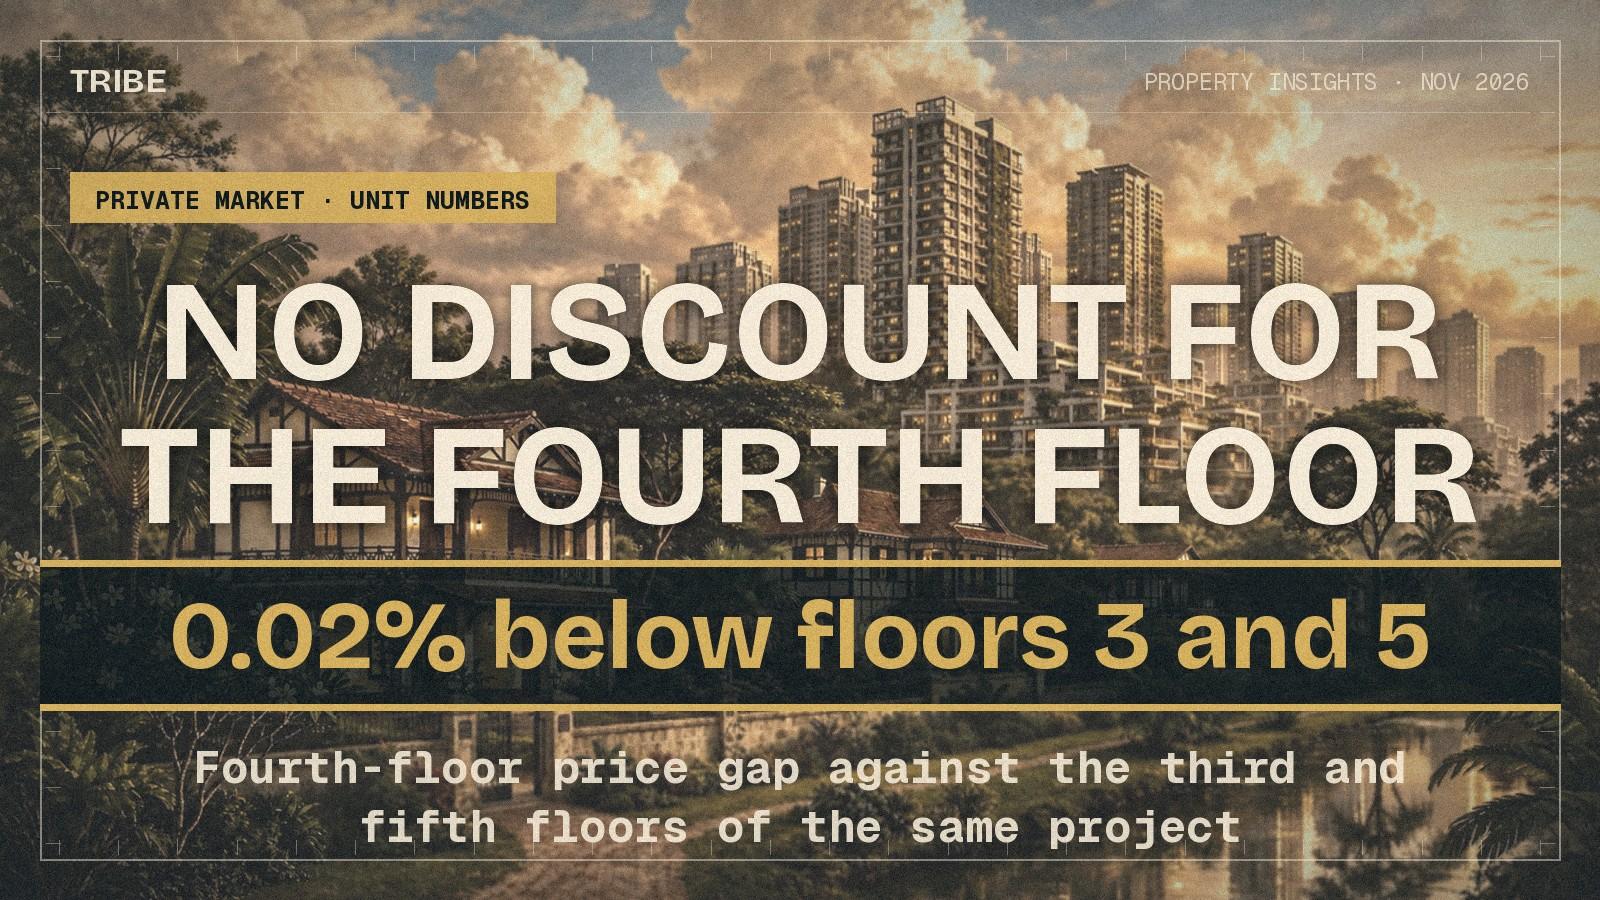
No Discount for the Fourth Floor. Moving One Storey Up to Avoid It Costs 0.67%.
20 November 2026Private Property Market
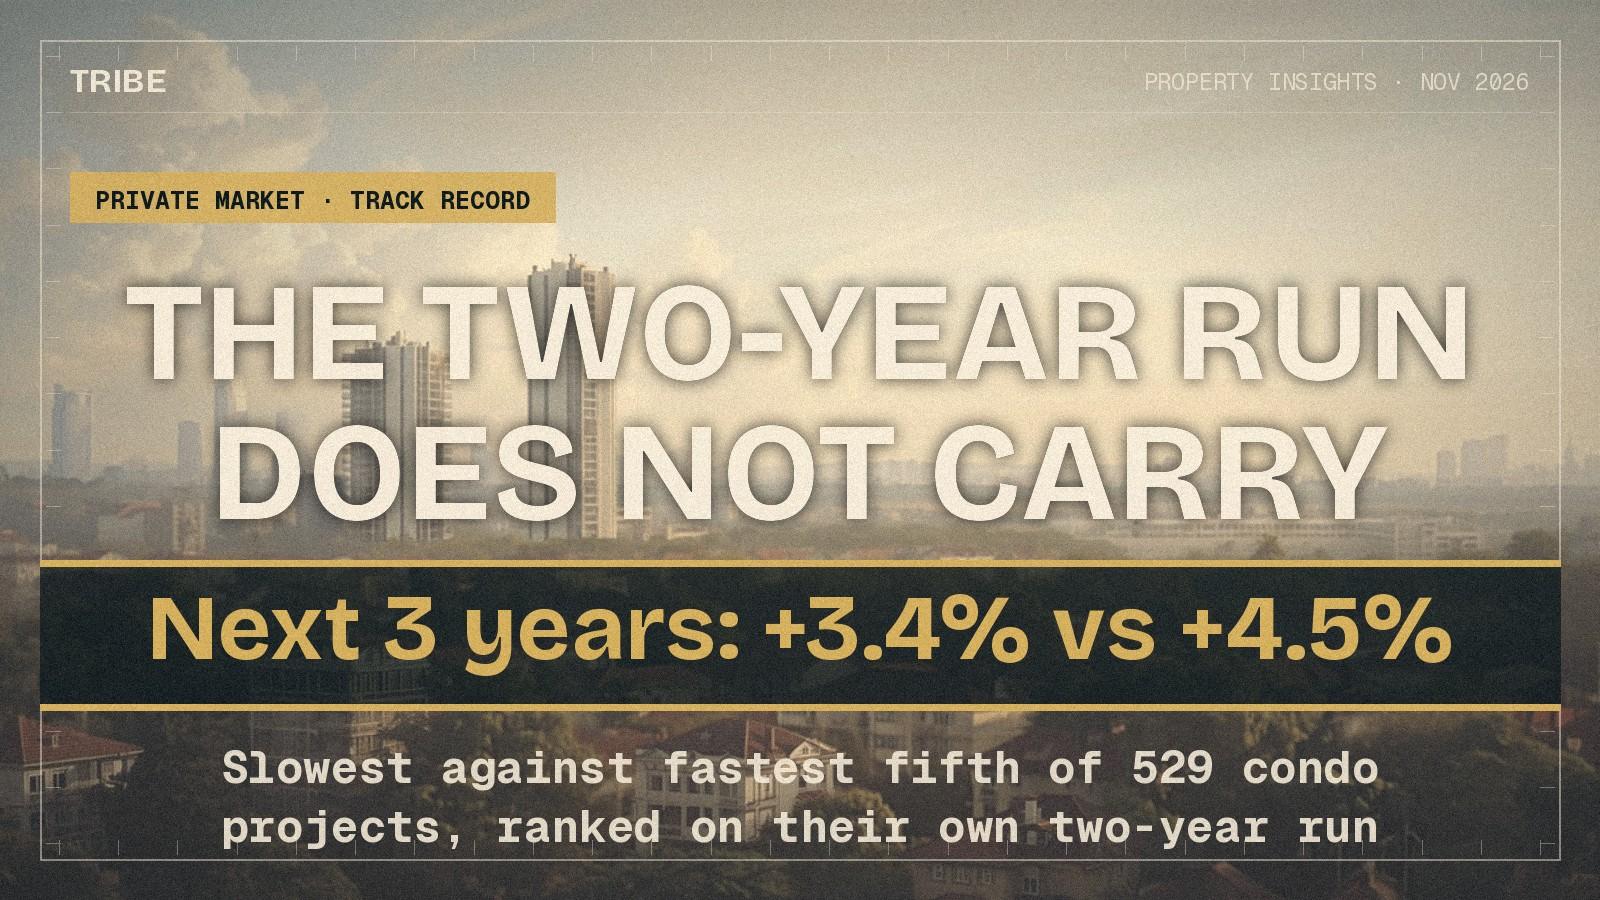
The Two-Year Run Does Not Carry. The Ten-Year Record Is Worth 3.5 Points.
16 November 2026Private Property Market
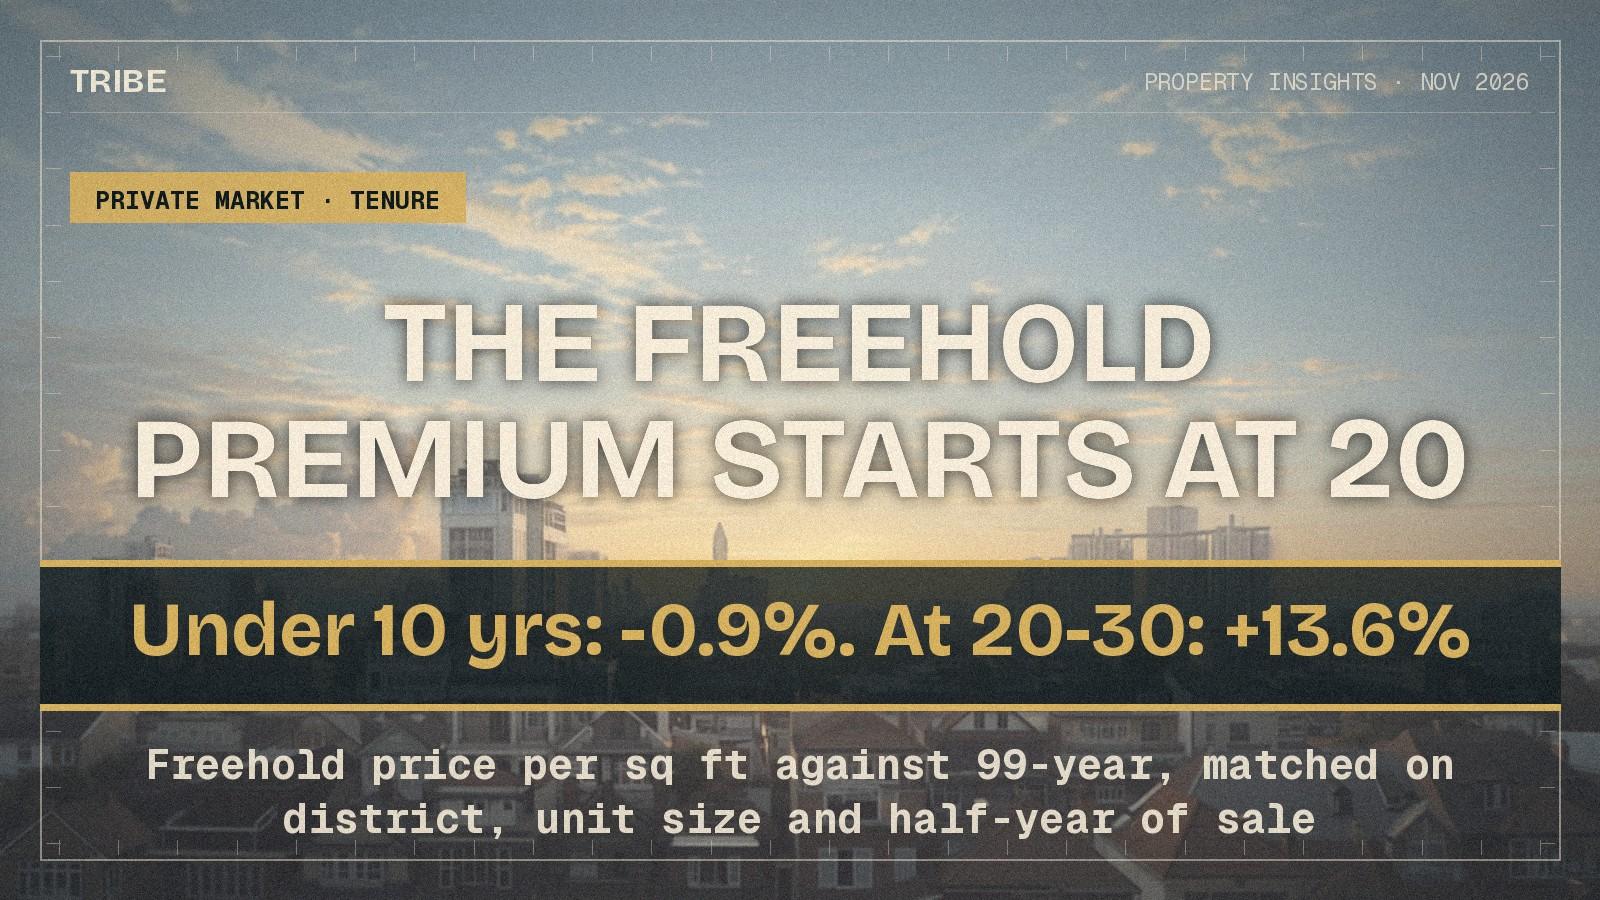
Freehold Costs No More Than Leasehold Under 10 Years Old. At 20 to 30, 13.6% More.
Next step
TRIBE Research
Written with AI assistance from TRIBE's own data and the public sources listed, then checked against them. General information, not financial advice. How we write
Sources
- TRIBE Resale Property Scorecard dataset, 2,350 scored condominiums · TRIBE · retrieved 17 November 2026
- RPS methodology: the seven factor weights, revised 16 November 2026 · TRIBE · retrieved 17 November 2026
Data as of October 2026.
How TRIBE scores and checks its analysis
Spotted an error, or a figure that has moved since publication? Tell us and we will correct it.
General information only, not financial, investment, legal or tax advice. It does not consider your own circumstances; check your own numbers before you commit.