Insights
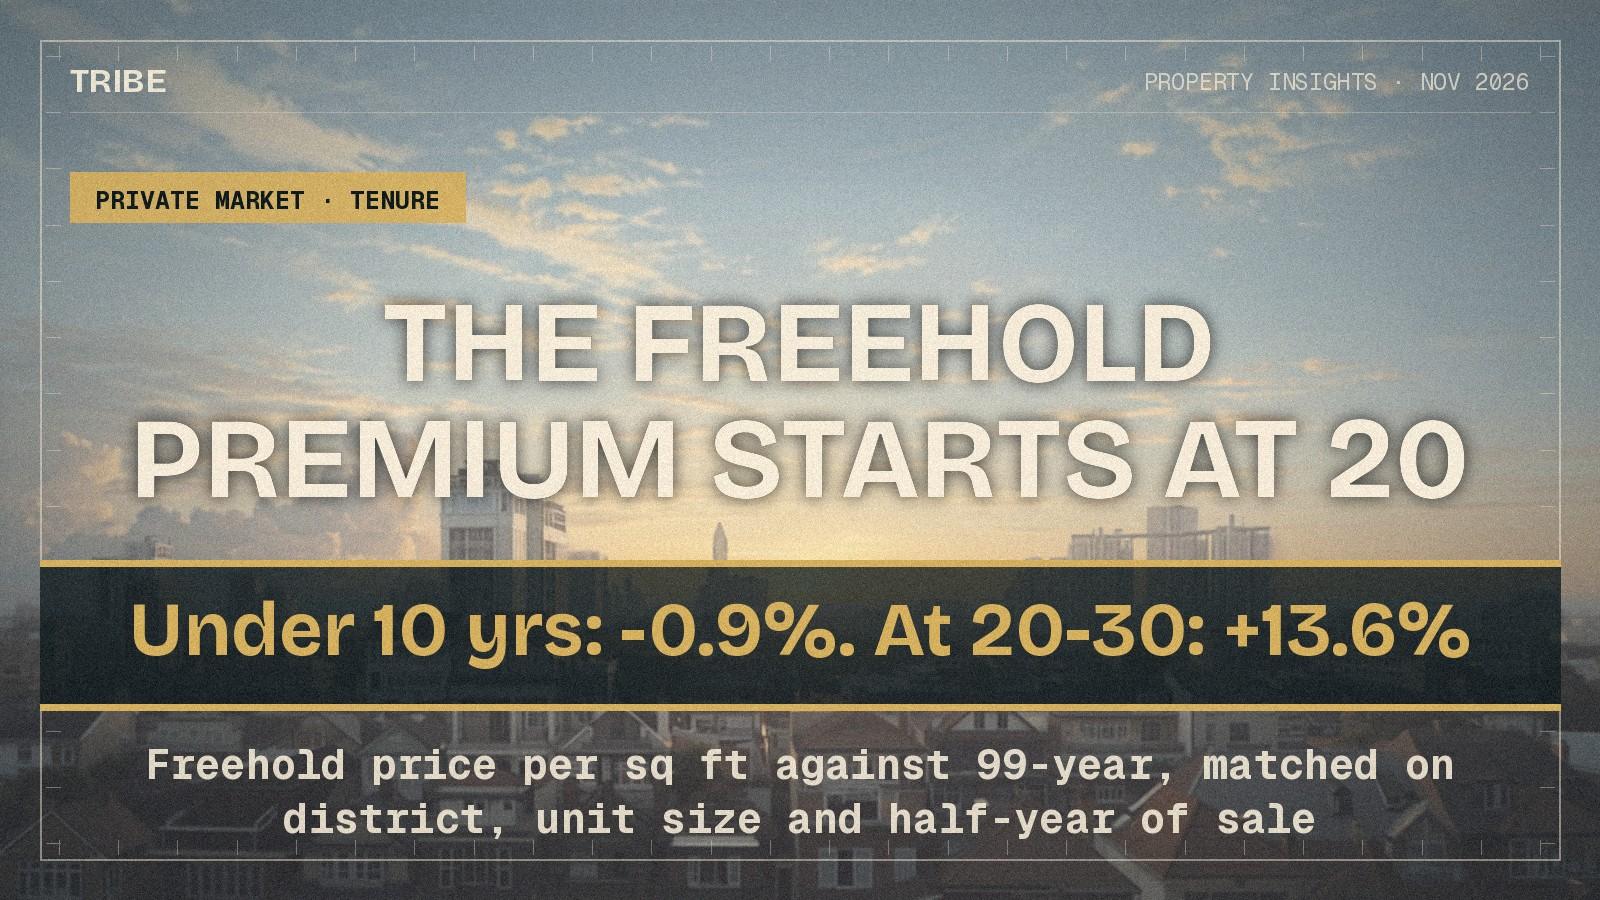
Freehold Costs No More Than Leasehold Under 10 Years Old. At 20 to 30, 13.6% More.
Matched on district, unit size and half-year of sale, a freehold condo under 10 years old sells 0.9% below a 99-year one. At 20 to 30 years old it sells 13.6% dearer. Before year 20, most of a leasehold's price decline is building age, which freehold suffers too.
By TRIBE Research · 16 November 2026 · 10 min read
The decision
- Who this is for
- Private condo buyers weighing freehold against 99-year, and owners of ageing leasehold units.
- The question
- Is freehold worth paying more for, and when?
- The short answer
- Not when the project is new. Matched on district, unit-size band and half-year of sale, a freehold condo under 10 years old sold 0.9% below a 99-year one per square foot. The premium appears with age: 3.0% at 10 to 20 years, 13.6% at 20 to 30, and 33.4% past 30. Before year 20 the leasehold's decline is mostly building age, which freehold takes as well.
- Next step
- Before paying a freehold premium, check the age of both projects. Under 10 years the market is charging nothing for tenure, so a premium asked at that age is not one the resale data supports.
The numbers behind it
- 0.9% belowFreehold against 99-year price per sq ft, projects under 10 years old, matched on district and size.
- 13.6% aboveSame matched comparison, projects 20 to 30 years old.
- 3.0 points, then 10.9Extra per-sq-ft fall a 99-year project takes over a freehold one, 10 to 14 years versus 20 to 24.
Across 58,502 condo resales between October 2021 and October 2026, freehold units sold for 20.9% more per square foot than 99-year ones. A buyer cannot use that number. Freehold and leasehold stock are not the same age and do not sit in the same places: 65.9% of these leasehold sales were in the Outside Central Region against 19.5% of the freehold ones.
Match them instead. Same district, same unit-size band, same half-year of sale. A freehold condo under 10 years old sold 0.9% below a 99-year one. At 20 to 30 years old it sold 13.6% above. Past 30 years, a third above.
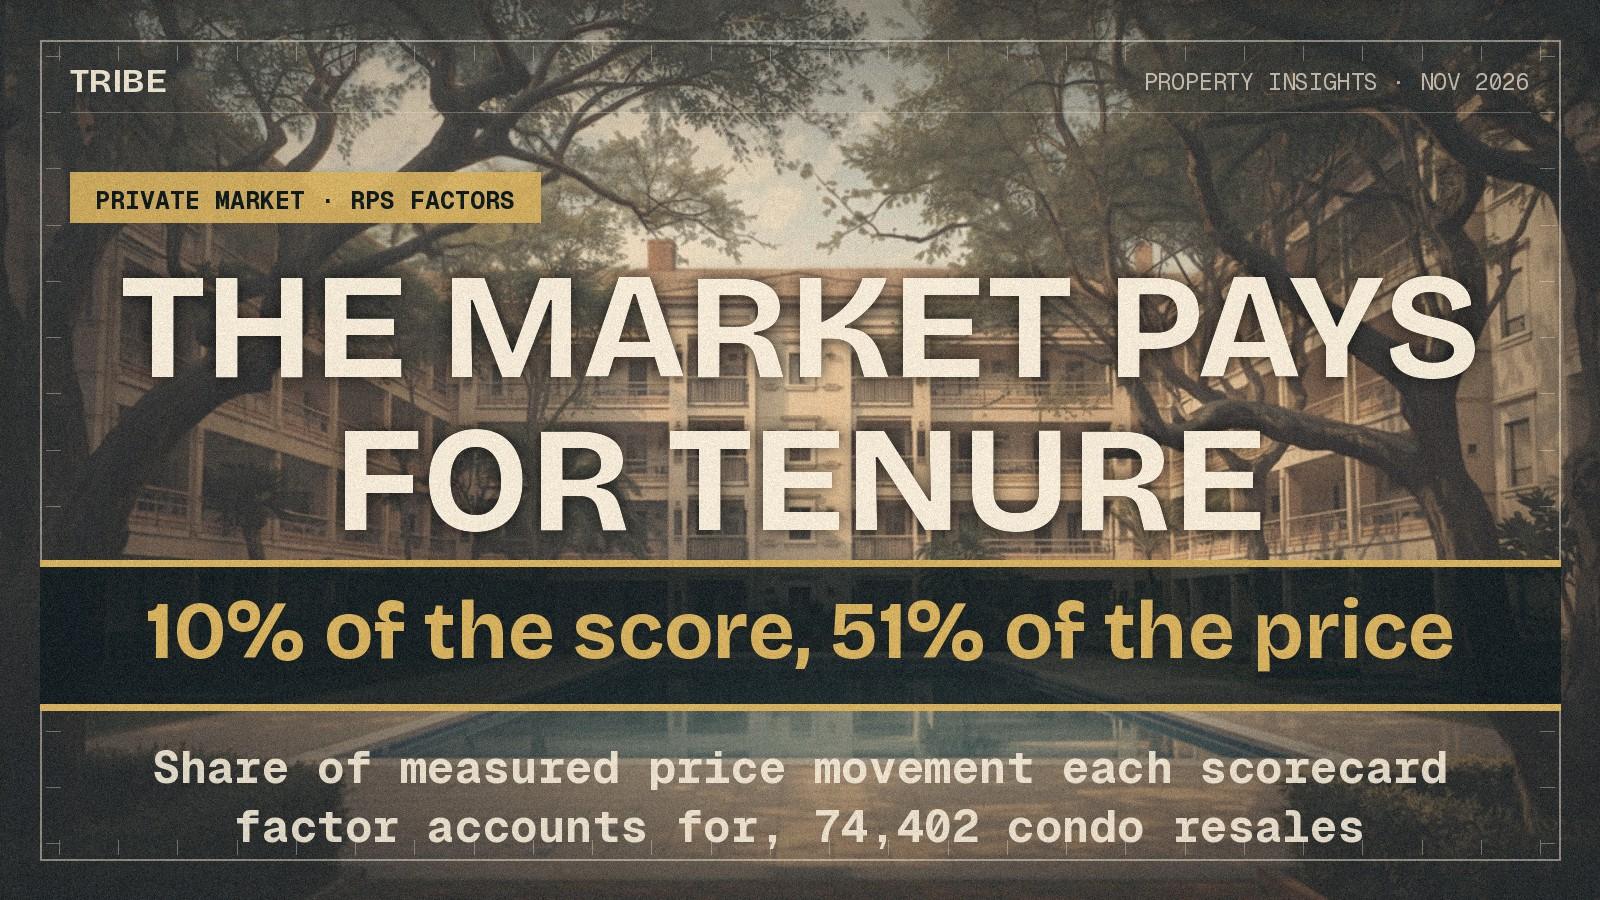
Tenure is 10% of a TRIBE Resale Property Scorecard grade. What the market pays for it is not a constant. It is close to nothing for a decade, and then it arrives.
The question a buyer is actually asking
Freehold against 99-year is usually argued as a principle. You either believe land you own forever is worth more, or you believe you will sell long before it matters.
The answerable version is narrower. Two units, similar size, same part of town, one freehold and one on a 99-year lease. How much more is the freehold one asking, and does that depend on how old the buildings are? It does, and the dependence is the whole finding.
The answer in plain language
The freehold premium is not a fixed percentage. It is near zero on new stock and grows with age.
On projects under 10 years old, freehold and leasehold sell at the same rate per square foot. The freehold unit was the dearer of the two in only 47.5% of matched groups, which is a coin flip that lands slightly the other way.
By 20 to 30 years old, the freehold unit is dearer in 80.9% of matched groups, by 13.6%. On the median 20-to-30-year-old leasehold resale in this sample, $1.4 million, that is about $190,000.
The strongest numbers, by age of the building
Each row compares freehold and 99-year resales in the same district, the same 250-square-foot size band, and the same half-year of sale, keeping only groups that contain at least two sales of each tenure.
| Project age at sale | Freehold vs 99-year, per sq ft | Matched groups | Freehold sales | 99-year sales | Freehold dearer in |
|---|---|---|---|---|---|
| Under 10 years | −0.9% | 356 | 2,569 | 9,669 | 47.5% |
| 10 to 20 years | +3.0% | 411 | 3,282 | 4,115 | 59.1% |
| 20 to 30 years | +13.6% | 320 | 2,106 | 3,790 | 80.9% |
| 30 years and over | +33.4% | 86 | 430 | 543 | 91.9% |
The gradient survives tightening the match. Add a five-storey band and the four figures become +2.1%, +5.9%, +14.2% and +45.3%. Require at least three sales of each tenure in every group and they become −1.4%, +2.2%, +13.0% and +40.9%. The level moves a little. The shape does not.
Why the headline comparison misleads
The pooled 20.9% gap is mostly age and location, not tenure.
| Freehold | 99-year | |
|---|---|---|
| Median price per sq ft | $1,762 | $1,457 |
| Median project age at sale | 14 years | 9 years |
| Share of sales in the Outside Central Region | 19.5% | 65.9% |
| Projects in the sample | 1,394 | 455 |
Leasehold sales skew new and suburban, freehold sales older and more central. Those two pulls work against each other, and the raw gap is what is left after they cancel badly.
Returns are worse. Raw, the leasehold units in this sample earned a median 3.94% a year against 2.94% for freehold, which reads as leasehold winning. It is purchase-year and location again: the median leasehold unit here was bought two years before completion, the median freehold one two years after, and they were bought in different markets. We have been here before, in what the freehold-versus-leasehold return gap looks like once you scrutinise it.
The controlled comparison: separating lease from age
If the freehold premium grows with age, the obvious reading is lease decay. That reading is half right, and the half that is wrong matters more.
Both tenures lose value as the building ages. The test is to measure each tenure against its own young stock, inside the same district, size band and half-year, and see how far apart the two curves run.
| Project age at sale | Freehold, vs its own under-10s | 99-year, vs its own under-10s | Difference |
|---|---|---|---|
| 10 to 14 years | −8.0% | −11.0% | 3.0 points |
| 15 to 19 years | −12.3% | −16.5% | 4.2 points |
| 20 to 24 years | −14.3% | −25.2% | 10.9 points |
| 25 to 29 years | −17.9% | −27.3% | 9.4 points |
| 30 to 34 years | −20.2% | −31.1% | 10.8 points |
| 40 to 44 years | −15.3% | −39.8% | 24.5 points |
Read the last column. For the first two decades, the part of the decline that is specifically about the lease is 3 to 4 points. A 15-year-old leasehold unit has lost 16.5% against new stock in its district, and 12.3 of those points are what a freehold unit of the same age lost too. That is the building getting older, and freehold does not protect against it.
From 20 years the two curves separate, and the lease-specific share jumps to around 10 points and keeps widening. Measured on remaining lease rather than age, the same break shows up: 99-year units with 85 to 95 years left sold 13.5% below those with more than 95 years left, and those with 75 to 85 years left sold 27.7% below.
Realised returns point the same way, more weakly. Matched on district, purchase year and holding period across 62,339 same-unit resales, freehold units bought when the project was under 10 years old earned 0.33 percentage points a year less than leasehold ones. Bought at 10 to 20 years old, they earned 0.53 points a year more.
Add a unit-size band to the match and those become −0.10 and +0.41 points, and the oldest band thins to 48 groups and a coin flip. The direction matches the price gradient. The size of it is not something we would put weight on.
What this does not prove
It does not prove freehold is a bad buy, or a good one. It measures what the market charged, not what tenure is worth to a particular household.
The match holds district, unit-size band, half-year of sale, and in one variant storey band. It does not hold the project itself: facilities, maintenance standard, exact location within a district, renovation, orientation or view. Freehold projects here are also far smaller, 1,394 of them against 455 leasehold ones, and project size is priced separately in our own scorecard.
The age bands are observational. The 40-year-old freehold units that still transact may differ from 40-year-old leasehold ones in ways the data cannot see, including the prospect of collective sale, which is not modelled here. These are realised sales only, so the figures describe transactions, not asking prices.
The return figures are annualised rates, not total profit, and they are gross: before buyer's stamp duty, any seller's stamp duty, agent and legal fees, and excluding rent received, maintenance charges, property tax and financing. A 0.3 point annual difference is inside what those costs can move.
Finally, this is five years of sales, not a law. Lease decay is partly a valuation convention and partly market behaviour, and both can change.
What this means if you are buying or selling
If you are buying something under 10 years old, the market is not charging you for tenure. That cuts two ways. A freehold premium asked at that age is not supported by what comparable resales did, and if two otherwise similar young projects are priced the same, the freehold one hands you the later-life premium for nothing.
If you are buying something 20 years old or more, treat the 13.6% as the price of avoiding the next stretch of decay, and check it against the decay itself. On this data the leasehold discount widens by about another 10 points over the following decade, so the premium is not obviously the wrong side of the trade.
If you are selling a leasehold unit around 15 years old, the discount you are facing is mostly age, not lease. The right comparison is freehold and leasehold resales of the same age in your own district, where the gap is 3 to 4 points, rather than the lease-decay tables, which price a much later part of the curve.
And if you are being told lease decay bites at 40 years remaining, the price data puts the break earlier: the curves separate at about 20 years old, which on a 99-year lease is 79 years left. For a parallel on paying at purchase and getting less back at resale, see what a high floor costs against what it returns.
Next step
Comparing a freehold unit with a 99-year one? Send us both projects with their completion years and the two unit sizes. We will show what each tenure sold for per square foot at that age in the same district, so the premium you are asked for can be checked against the premium the market paid. The Resale Price Check runs the same lookup on a single project, and the Resale Property Scorecard shows how tenure is scored among the seven factors.
Based on 58,502 freehold and 99-year condominium resale transactions between October 2021 and October 2026, across 1,849 projects, drawn from TRIBE's transaction dataset and joined to the TRIBE Resale Property Scorecard read on 16 November 2026; 2,126 of the 2,350 scored projects, 90.5%, matched a project in the transaction data and the rest are excluded. The matched comparison groups sales by district, 250-square-foot unit-size band and half-year of sale, keeping only groups containing at least two sales of each tenure; the robustness variants add a five-storey band or raise the threshold to three sales. The age curves compare each tenure against its own under-10-year-old sales within the same groups. The return figures come from 62,339 same-unit resales with a recorded prior purchase, bought between 2000 and 2025 and sold in the same window, matched on district, purchase year and three-year holding band, and are annualised rates gross of stamp duties, agent and legal fees, and excluding rent, maintenance charges, property tax and financing. Tenure is one of seven weighted factors in the scorecard, at 10%; see the methodology. General information, not advice for any particular property or household.
Your next step
Comparing a freehold unit with a 99-year one? Send us both projects with their completion years and unit sizes. We will show what each tenure sold for per square foot at that age in the same district.
A consultant replies on WhatsApp. No registration, no obligation.
Prefer a personal read on your situation? Arrange a consultation →Keep reading
21 November 2026Private Property Market
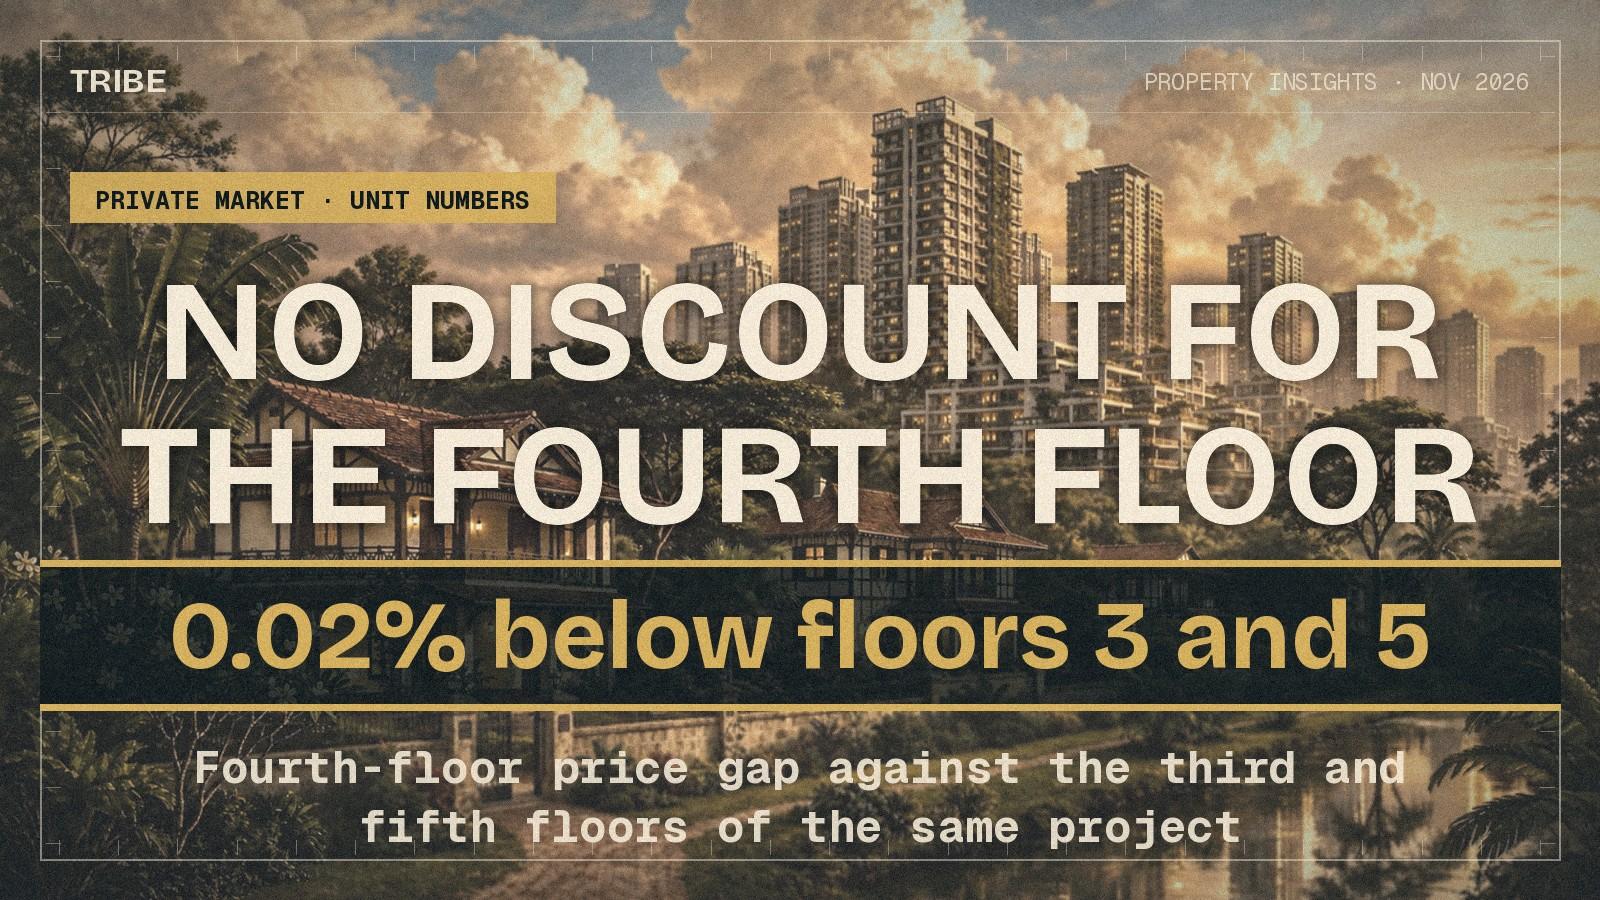
No Discount for the Fourth Floor. Moving One Storey Up to Avoid It Costs 0.67%.
20 November 2026Private Property Market
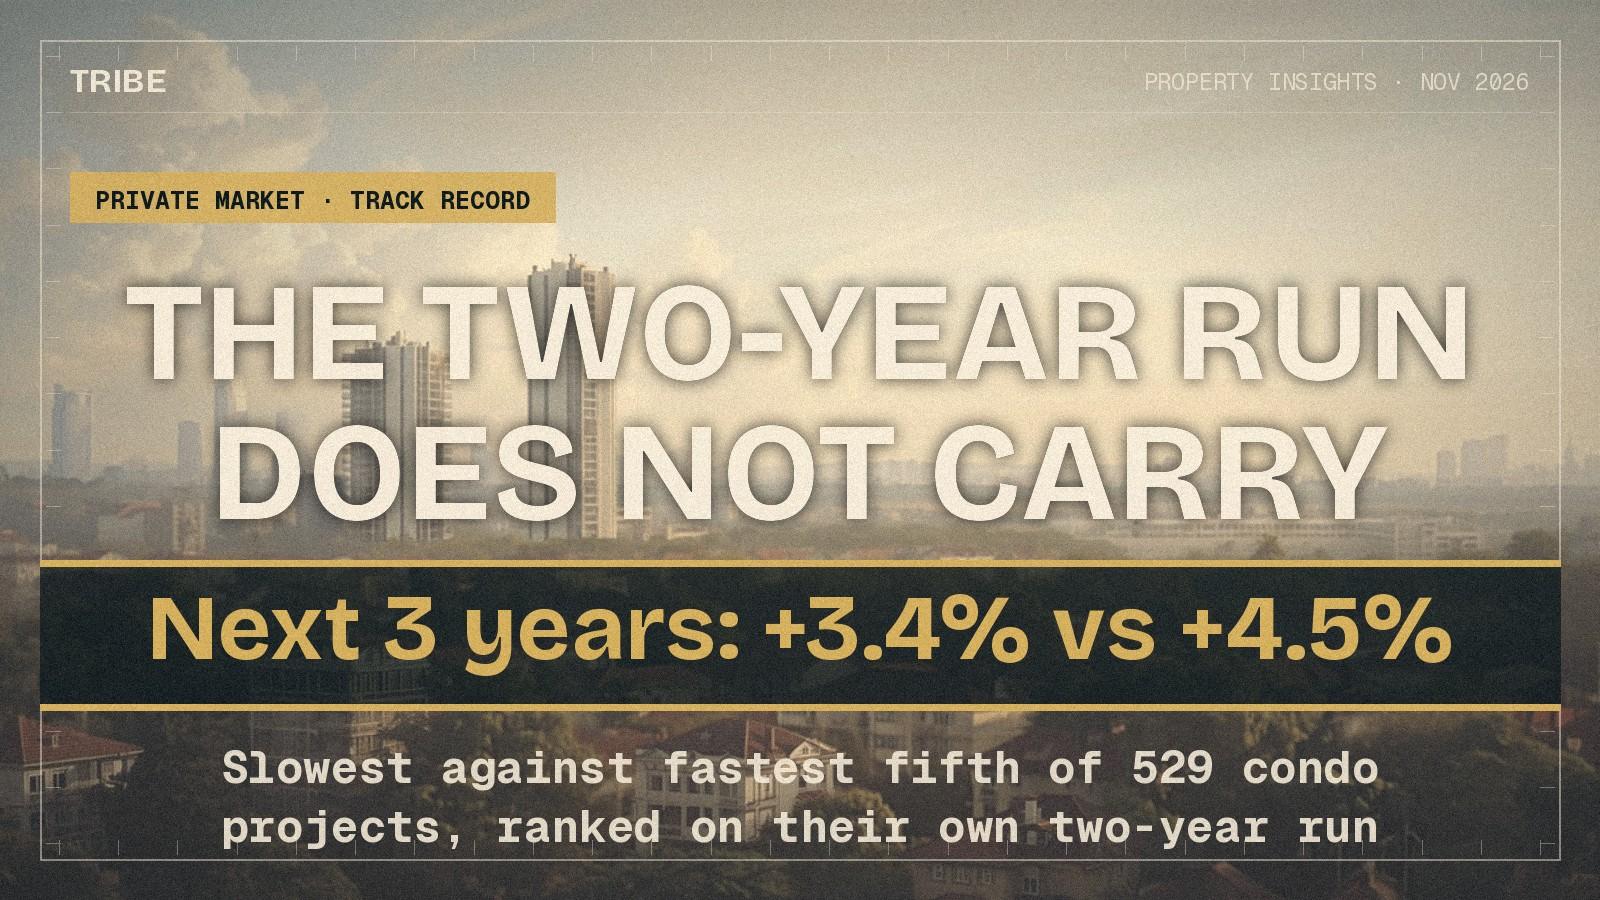
The Two-Year Run Does Not Carry. The Ten-Year Record Is Worth 3.5 Points.
17 November 2026Private Property Market
Tenure Is 10% of the Score and 51% of What the Market Pays
Next step
TRIBE Research
Written with AI assistance from TRIBE's own data and the public sources listed, then checked against them. General information, not financial advice. How we write
Sources
- TRIBE Resale Property Scorecard dataset, 2,350 scored condominiums · TRIBE · retrieved 16 November 2026
- RPS methodology: the seven weighted factors, including Tenure at 10% · TRIBE · retrieved 16 November 2026
Data as of October 2026.
How TRIBE scores and checks its analysis
Spotted an error, or a figure that has moved since publication? Tell us and we will correct it.
General information only, not financial, investment, legal or tax advice. It does not consider your own circumstances; check your own numbers before you commit.