Insights
The Two-Year Run Does Not Carry. The Ten-Year Record Is Worth 3.5 Points.
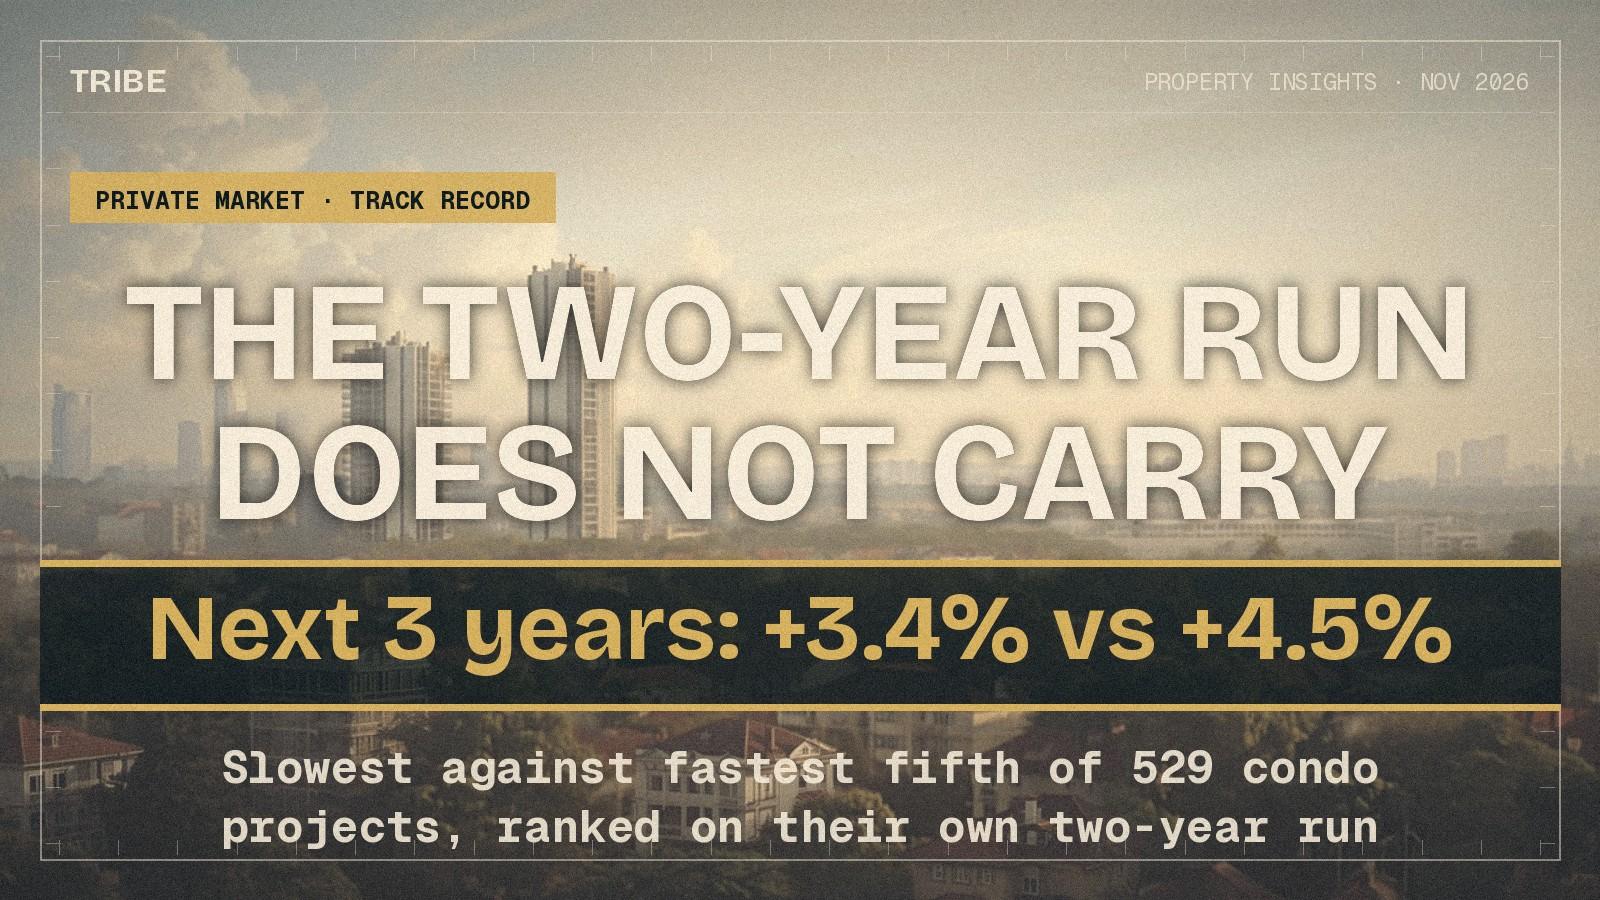
Rank 529 condo projects by price growth in the two years to September 2023 and the next three years come out flat: +3.4% for the slowest fifth, +4.5% for the fastest. Rank the same projects by their since-purchase record and it runs +2.1% to +5.6%.
By TRIBE Research · 20 November 2026 · 10 min read
The decision
- Who this is for
- Condo buyers comparing two shortlisted projects where one has clearly risen faster recently
- The question
- Does a project's recent price run tell me anything about what it will do next?
- The short answer
- No. Ranking 529 projects by their growth in the two years to September 2023 left the next three years almost unchanged, +3.4% for the slowest fifth against +4.5% for the fastest, and the five groups did not even rise in order. Ranking the same projects by their annualised appreciation since purchase moved it from +2.1% to +5.6%. The long record carries. The recent run does not.
- Next step
- Stop comparing two-year charts. Ask what each project has returned a year to owners who held it five years or more, and compare that against same-vintage peers.
The numbers behind it
- +2.1% against +5.6%Price growth to October 2026, slowest against fastest fifth of 529 projects on their long record
- +3.4% against +4.5%The same later growth, same projects, ranked instead on the prior two years' growth
- 18.3% of 109Of the fastest fifth over those two years, still fastest over the next three; 20% is chance
Two condos in the same district. One is up 15% over the last two years, the other up 1%. The first looks like the project with momentum and the second like the one the market has passed over. Across 529 scored projects, that difference tells you nothing about the next three years: sorted by the two-year run, the slowest fifth went on to grow +3.4% and the fastest +4.5%.
Sort the same 529 projects by something slower, the annualised return they have actually delivered to owners who held them, and the next three years separate properly: +2.1% for the bottom fifth against +5.6% for the top. That is 3.5 points, or about S$56,000 on the median S$1,602,000 condo transaction of the last three years.
The question in front of a buyer
Every shortlist eventually comes down to two projects, and the chart is the easiest thing to reach for. Price per square foot over two years, one line steeper than the other, and the steeper one gets treated as the better asset.
It is a reasonable instinct. A project that is rising is presumably rising for a reason, and reasons tend to persist. The question is whether the recent slope is one of those reasons or just the part of the price history that happens to be visible.
TRIBE's Resale Property Scorecard takes a position on this. Its heaviest factor, Project's Historical Performance, carries 30% of the score since the 16 November revision, and it is deliberately not a two-year chart: it scores annualised appreciation since launch against projects of the same vintage. This article tests whether that choice of window is the right one.
The answer in plain language
The window is doing almost all the work. The long record predicts; the recent run does not.
Measured out of sample, on information that existed by September 2023 and outcomes that happened afterwards, one point a year of long-run annualised appreciation is worth +0.767 points of price growth over the following three years, with a t-statistic of +5.30. One point of two-year growth is worth -0.131 points, with a t-statistic of -3.18. Not zero, but pointing the other way.
The strongest supporting numbers
The two rankings, side by side, on the same 529 projects and the same later window:
| Fifth | Long record to Sep 2023 | Next 3 years | Two-year run to Sep 2023 | Next 3 years |
|---|---|---|---|---|
| Slowest | +0.67% a year | +2.1% | +0.8% | +3.4% |
| Second | +1.95% a year | +3.9% | +5.2% | +4.6% |
| Middle | +2.83% a year | +4.2% | +7.4% | +4.5% |
| Fourth | +3.53% a year | +5.4% | +10.6% | +4.4% |
| Fastest | +4.64% a year | +5.6% | +14.7% | +4.5% |
The left-hand ranking rises in order through all five fifths. The right-hand one does not rise at all: its second fifth, at +4.6%, ends up ahead of its fastest.
Why the two-year run looks like information
The two-year run is not a small signal. It is a large, visible one: across these projects it ran from +0.8% at the tenth percentile to +14.8% at the ninetieth, a 14-point spread, against a 4-point spread in the long record. The thing a buyer can see most easily is also the thing that varies most.
It is also not noise in the measurement sense, which is the obvious objection to a null. Split each project's caveats at random into two halves and measure the two-year growth separately in each: the halves correlate +0.43 across 410 projects. The long record, measured the same way, correlates +0.91. So the two-year figure is a real quantity, measured with moderate precision, about a project's recent past.
That matters for reading the result. Measurement noise pulls a coefficient toward zero. It does not push it through zero to -0.131. The recent run is being measured, and what it measures mildly reverses.
The controlled comparison
The long record is built only from information available by September 2023: 16,669 resale and sub-sale caveats where the seller's own purchase was five or more years earlier, median hold 10.0 years, all closed between October 2021 and September 2023. The outcome is measured on 27,697 later caveats, from October 2023 to October 2026. No transaction appears on both sides.
Compared only against projects in the same district, the long record correlates +0.21 with the next three years and the two-year run correlates -0.09.
The gap between the top and bottom fifth on the long record survives every cut we tried:
| Variation | Gap in next-three-year growth |
|---|---|
| Main specification, 5+ repeat sales per project | +3.5 points |
| 3 or more repeat sales | +3.5 points |
| 8 or more | +3.7 points |
| 10 or more | +4.1 points |
| Holds of 7 years or more only | +4.0 points |
| Holds of 10 years or more only | +3.4 points |
| Rest of Central Region, 166 projects | +5.4 points |
| Core Central Region, 88 projects | +3.8 points |
| Outside Central Region, 275 projects | +2.3 points |
| Freehold, 153 projects | +5.8 points |
| 99-year, 344 projects | +2.3 points |
On the same 529 projects, the published Historical Performance factor sorts the later growth the same way: projects scoring 1 to 6 grew a median +3.6%, those scoring 7 or 8 grew +4.1%, and those scoring 9 or 10 grew +5.9%. Our independently built long record correlates +0.63 with that published score, which is the expected result if both are measuring the same slow quantity.
What this analysis does not prove
The published factor is not an out-of-sample test and we are not presenting it as one. It is scored on price history running through October 2026, which overlaps the outcome window, so part of its apparent sorting power is the same information on both sides. The out-of-sample claim rests on our own September 2023 cut-off, where it does not.
It does not prove that a long record causes future growth. Both are more likely to be symptoms of something durable about a project, the layouts, the land, the management, the catchment, that our controls for district, tenure, price level and trading volume only partly absorb. A project with a strong long record and a newly announced problem is not covered by any of this.
The window also matters to how growth is measured. Each project's growth is measured inside a window, first half against second half, rather than between two window medians, because the between-window version inherits the earlier window's own trend and flatters whatever has just been rising.
Three years is also one market, not a general law. The outcome window runs from October 2023 to October 2026 and carries that period's rates, supply and cooling measures. Figures are transacted prices and exclude stamp duties, agent and legal fees, maintenance, property tax, financing and any rent received.
What this means for a buyer or a seller
For a buyer, the practical change is which number to ask for. The two-year chart is the easiest comparison to make and close to worthless: the spread in later outcomes it produces, 1.1 points, is about S$17,600 on that median transaction, and it is not even ordered. The long record produced 3.5 points, or about S$56,000, in the right order, across every fifth.
So ask what the project has returned a year to owners who held it five years or more, and ask it against projects of the same vintage, because a 2018 completion and a 2004 one are not comparable on raw appreciation. That is the comparison the scorecard's 30% factor is built on, and it is the one that carried.
For an owner, the reading is more cautious. A unit that has run hard for two years has no extra claim on the next three, and in this data a small negative one. If the recent run is the reason to hold, there is not much under it. The long record is a better reason, and it does not change month to month.
Where to start
Put both shortlisted projects through the Resale Price Check below and compare what each has actually returned to sellers who held, rather than the shape of the last two years. Related reading: what the market pays for each scorecard factor, why the score is weaker than one of its factors and how the freehold premium builds with age.
Computed from TRIBE's private-condominium caveat dataset: 117,319 resale and sub-sale caveats across 2,325 projects lodged between October 2021 and October 2026, each carrying the seller's own purchase date and price, joined by project name to the 2,350 published scorecards at rps-data-v2.json (2,117 projects matched, 91.1%). The analysis set is the 529 projects with at least five qualifying repeat sales closed by September 2023 and at least four caveats in each half of both windows. The long record is the median annualised return on 16,669 repeat sales with holds of five to 28.6 years, median 10.0 years, closed October 2021 to September 2023; returns outside -25% to +40% a year are excluded. Later growth is each project's median price per square foot in the second half of October 2023 to October 2026 against the first half, measured on 27,697 caveats. The regression adds district and tenure fixed effects, log median psf and log caveat count. Figures are transacted prices and exclude stamp duties, agent and legal fees, maintenance, property tax, financing and rent received. Three years of one market, not a law. General information, not advice for any particular property or household. Methodology published. No spin.
Your next step
Comparing two condos and one has clearly run harder lately? Send us both projects and the unit size you are weighing. We will show each one's long record against its same-vintage peers.
A consultant replies on WhatsApp. No registration, no obligation.
Prefer a personal read on your situation? Arrange a consultation →Keep reading
21 November 2026Private Property Market
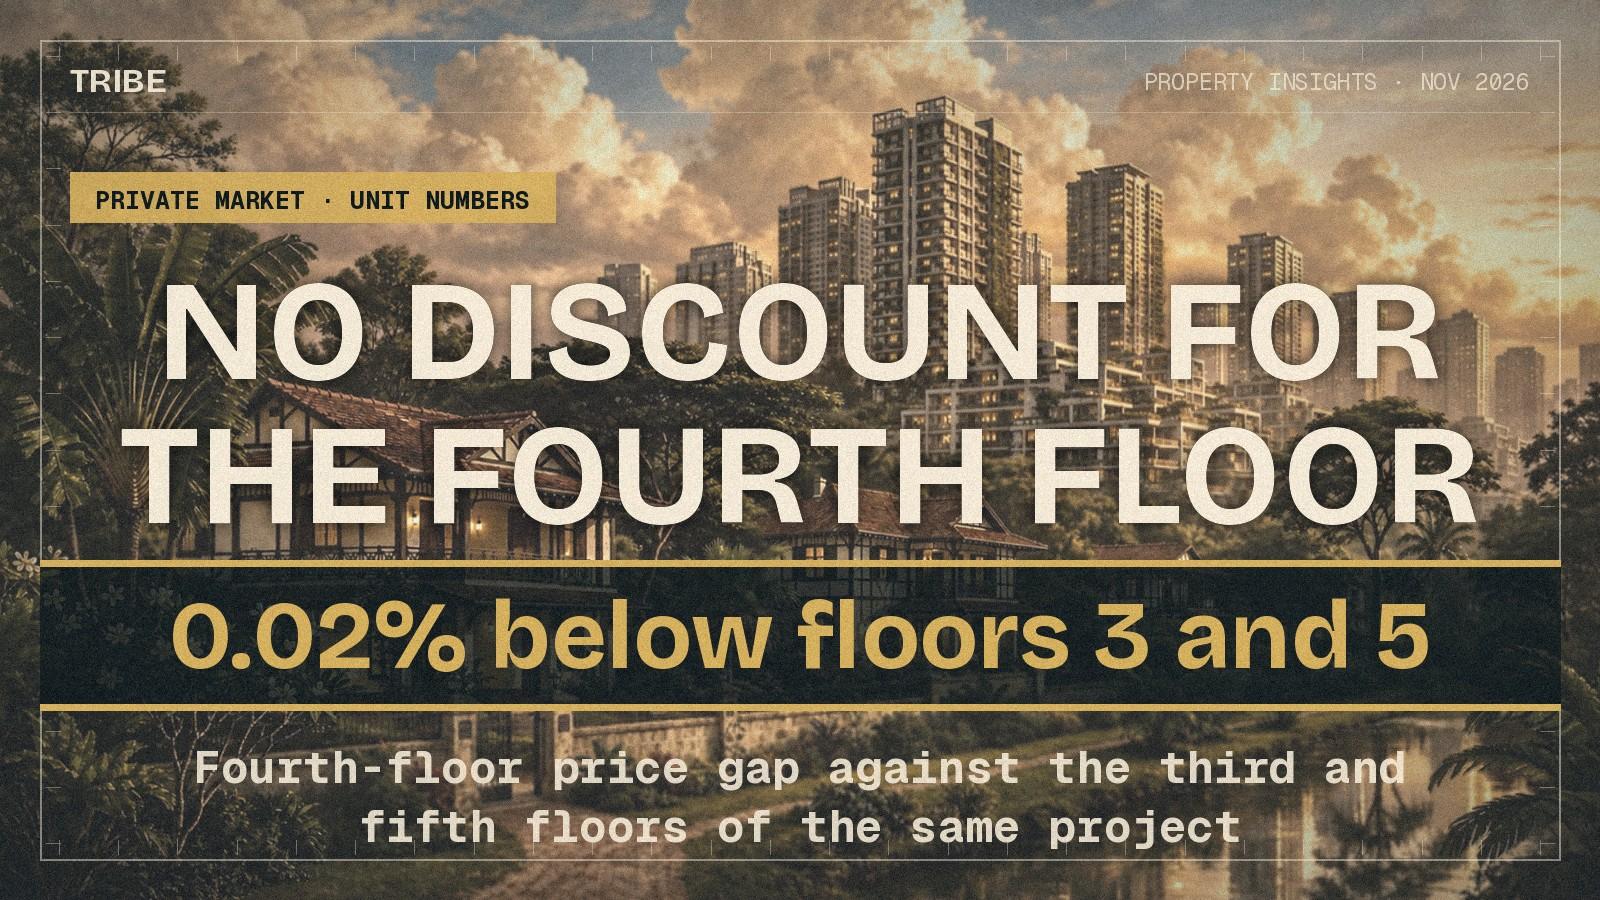
No Discount for the Fourth Floor. Moving One Storey Up to Avoid It Costs 0.67%.
17 November 2026Private Property Market
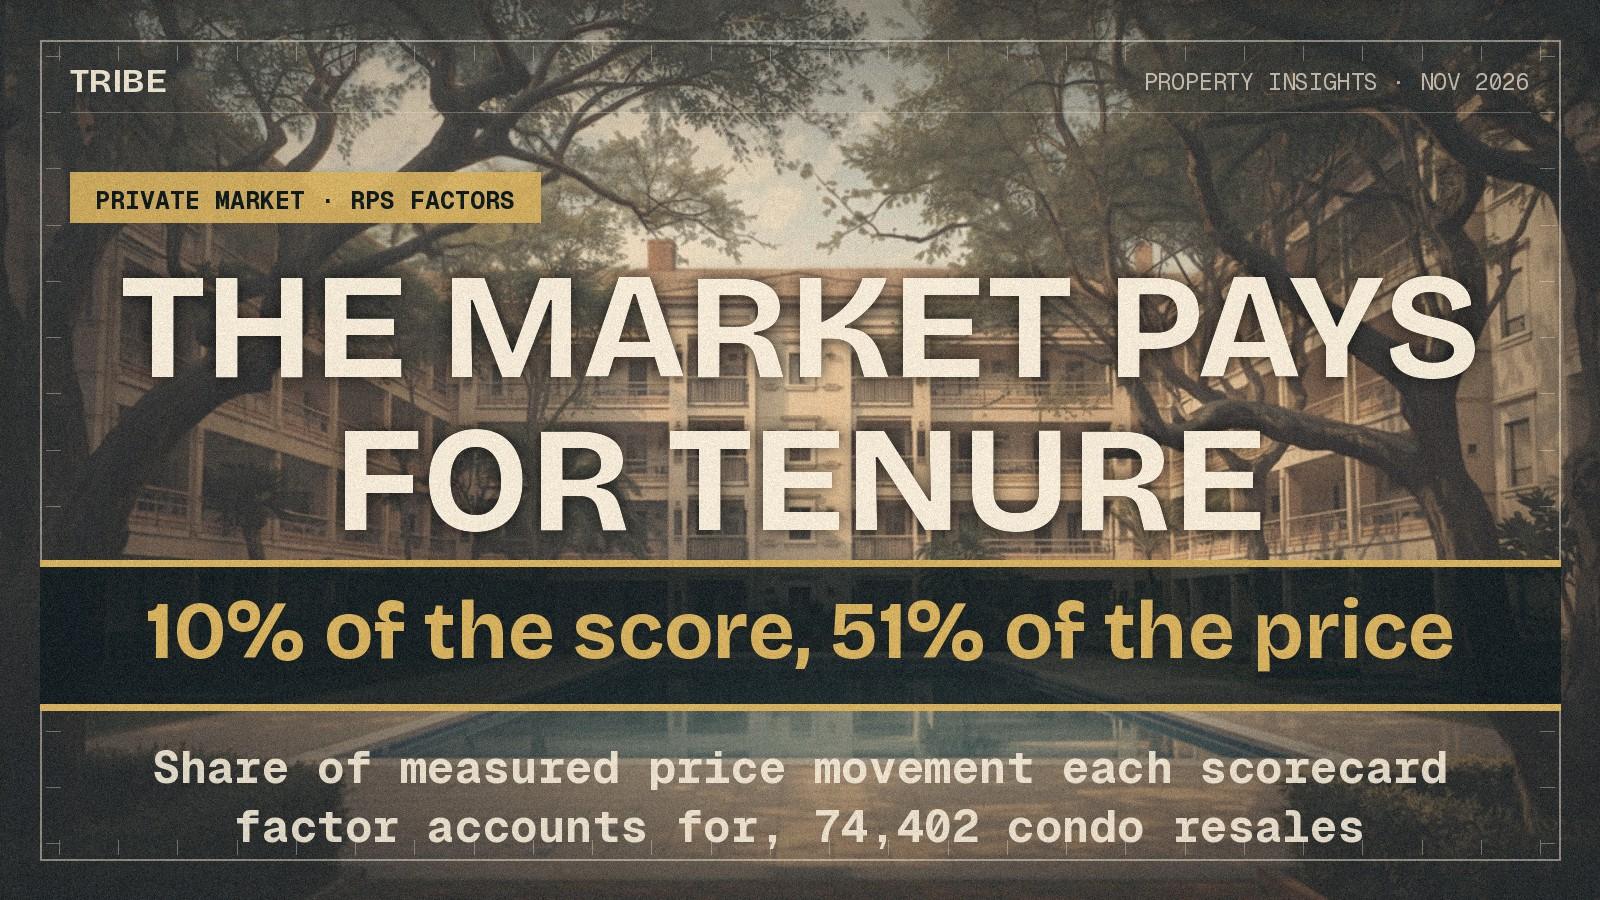
Tenure Is 10% of the Score and 51% of What the Market Pays
16 November 2026Private Property Market
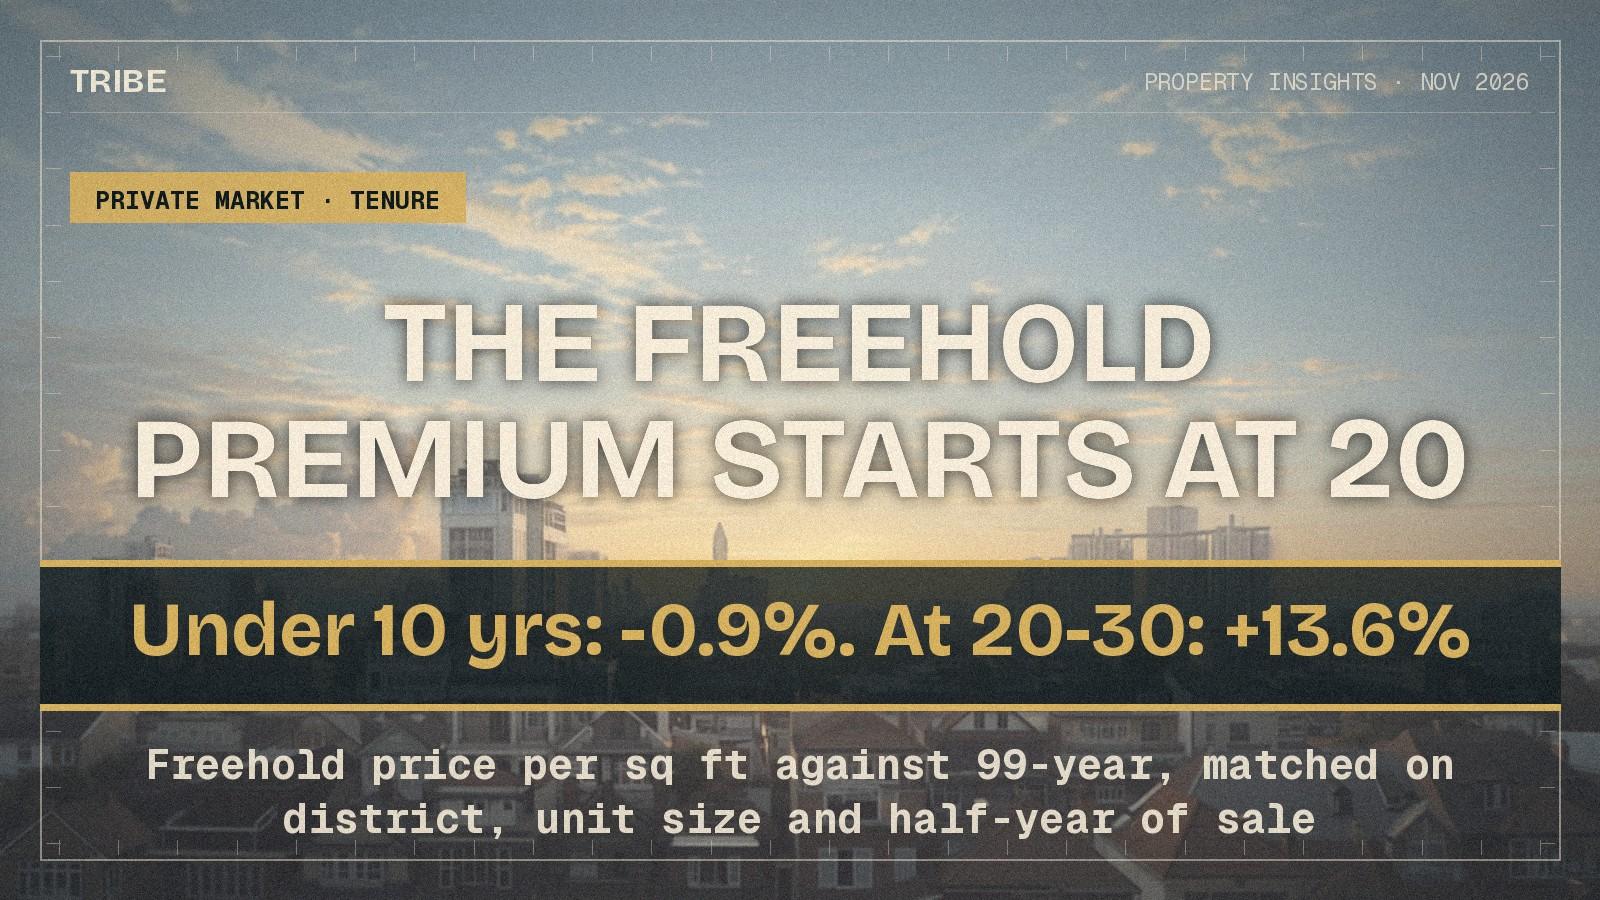
Freehold Costs No More Than Leasehold Under 10 Years Old. At 20 to 30, 13.6% More.
Next step
TRIBE Research
Written with AI assistance from TRIBE's own data and the public sources listed, then checked against them. General information, not financial advice. How we write
Data as of October 2026.
How TRIBE scores and checks its analysis
Spotted an error, or a figure that has moved since publication? Tell us and we will correct it.
General information only, not financial, investment, legal or tax advice. It does not consider your own circumstances; check your own numbers before you commit.