Insights
The High Floor Costs 0.51% a Storey to Buy. At Resale It Is Worth 0.31%.
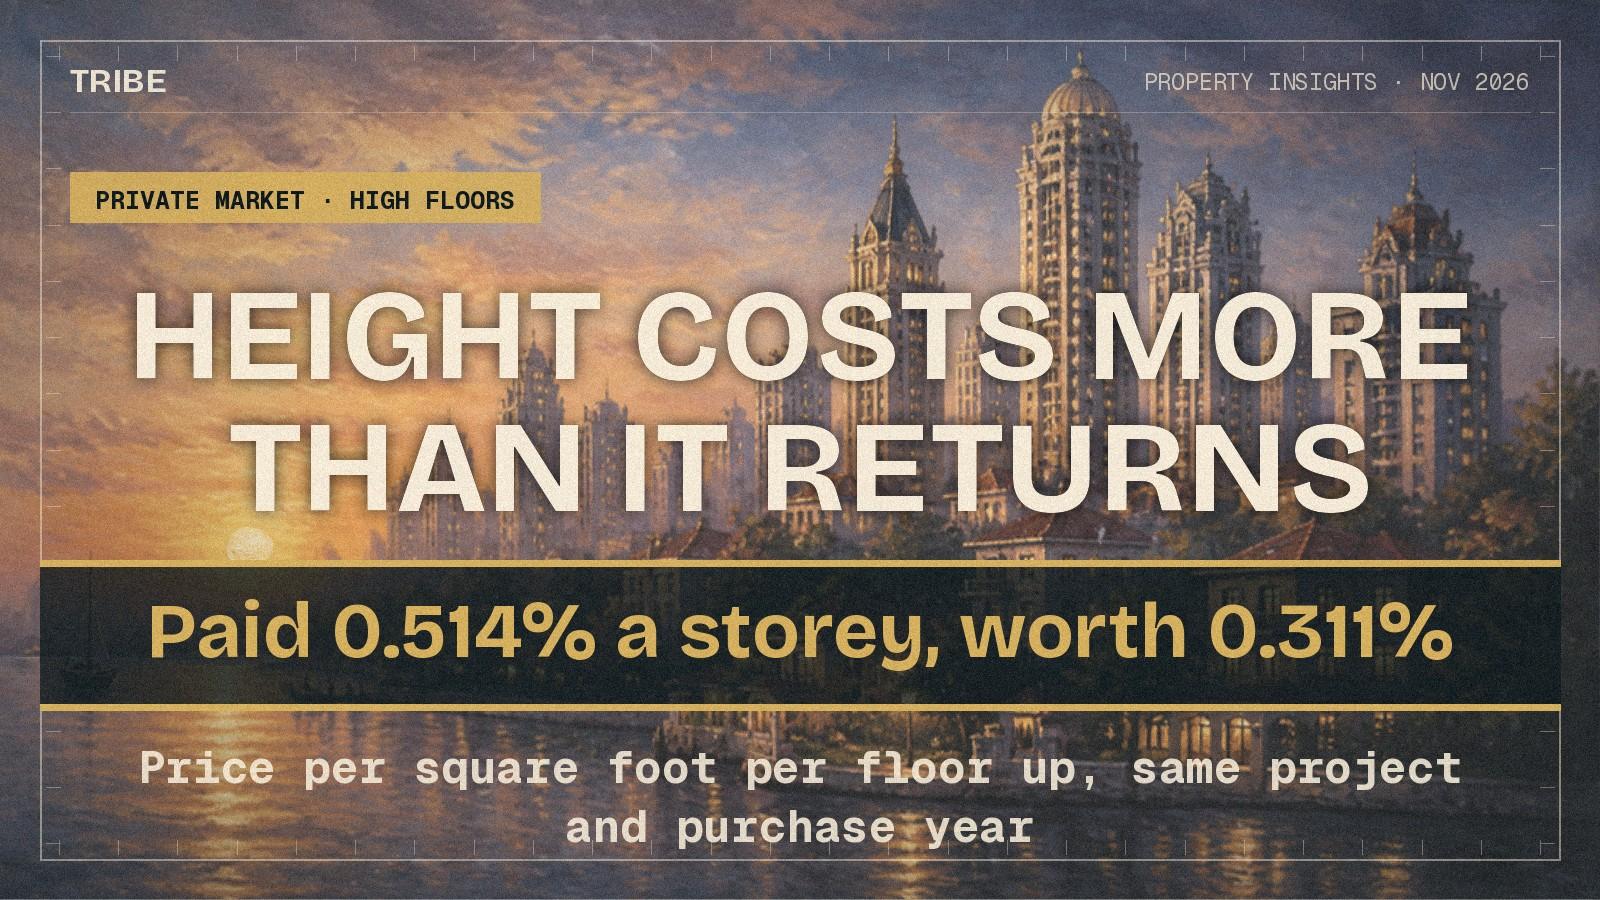
Comparing units in the same project bought in the same year, each storey up cost 0.514% more per square foot at purchase and was worth 0.311% more at resale. Nine storeys, the median height span inside a project, gives up about 0.20 percentage points a year.
By TRIBE Research · 11 November 2026 · 9 min read
The decision
- Who this is for
- Condo buyers choosing between two stacks in a project they have already chosen
- The question
- Is the higher floor worth the premium?
- The short answer
- As a home, that is your call. As a return, no. In the same project bought in the same year, each storey up cost 0.514% more per square foot and was worth only 0.311% more at resale, so 39.5% of the premium did not come back. A nine-storey step gives up about 0.20 percentage points a year. Control for the price paid and the floor itself costs nothing.
- Next step
- Ask what the stack you want has actually transacted at in that project. Pay the project's going rate for height rather than a premium to it.
The numbers behind it
- 0.514% a storeyExtra price per square foot paid per floor up, same project and year
- 0.311% a storeyWhat each floor was worth per square foot at resale, same groups
- 0.20 points a yearAnnualised return given up over a nine-storey step, the median span in a project
Every condo showroom sells height. The same layout, nine floors up, carries a price and a reason: better view, less noise, stronger resale. Across 8,057 same-unit resales where two or more floors of the same project can be compared, the first two reasons are a matter of taste and the third does not hold. Each storey up cost 0.514% more per square foot at purchase and was worth 0.311% more when the unit was sold.
That is a premium that returns about three-fifths of itself. The remaining two-fifths shows up as a lower annualised return: about 0.20 percentage points a year across a nine-storey step, which is the median height span available inside a single project.
The question in front of a buyer choosing a stack
By the time most buyers compare floors, the project is already decided. What is left is a choice between two near-identical units at different heights, with a price difference attached and an agent's assurance that the higher one holds value better.
That assurance is testable, and it has to be tested inside one project. Comparing high floors across the market against low floors across the market compares towers against walk-ups, and the city core against the suburbs.
The answer in plain language
Height is priced correctly as an amenity and generously as an investment. In the same project, bought in the same year, each additional storey was associated with 0.0221 percentage points a year less annualised return, with a t-statistic of -8.5 across 8,057 resales in 2,321 project-and-purchase-year groups.
Comparing the top and bottom stacks directly, in the 1,180 groups spanning at least five floors, the high floor earned a median 0.15 percentage points a year less and came out ahead in only 43.0% of them.
But the cause is not height. It is the price paid for height, and that distinction is the useful part of this analysis.
The strongest supporting numbers
The premium at entry and the premium at exit, measured the same way inside the same groups, comparing units with the same bedroom count and the same floor area:
| Measured on | Premium per storey | t |
|---|---|---|
| Price per square foot paid at purchase | +0.514% | +28.8 |
| Price per square foot achieved at resale | +0.311% | +18.4 |
A storey of height is worth 60.5% at resale of what it cost at purchase, so 39.5% of the premium does not come back. Over a nine-storey step the entry premium compounds to 4.72% and the exit premium to 2.83%.
In dollars, two units in the same project bought the same year, nine floors apart, with the lower one at $1,500,000 and a ten-year hold at the sample's median three-bedroom return:
| Low floor | High floor | |
|---|---|---|
| Purchase price | $1,500,000 | $1,570,765 |
| Annualised return | 4.08% | 3.88% |
| Value after ten years | $2,237,505 | $2,298,752 |
| Gain | $737,505 | $727,987 |
The high floor ends $61,247 ahead in value, having cost $70,765 more to buy. The $9,518 difference is what the height premium failed to return, before any transaction cost.
Why the obvious comparison misleads
Looked at across the market, high floors appear to do slightly worse, and the gap looks larger than it is:
| Floor band | Repeat sales | Median entry psf | Median annualised return |
|---|---|---|---|
| 1 to 5 | 6,586 | $1,178 | 3.38% |
| 6 to 10 | 3,195 | $1,242 | 3.45% |
| 11 to 15 | 1,709 | $1,315 | 3.48% |
| 16 to 20 | 1,000 | $1,457 | 3.11% |
| 21 and above | 1,046 | $1,810 | 2.18% |
That table is mostly a map of where tall buildings are. Units above the twentieth storey sit in the central region and the city fringe, in newer towers bought closer to launch pricing. The 1.20-point gap between the lowest and highest bands is a comparison between neighbourhoods and cycles, not between floors.
The controlled comparison
Holding the project and the year of purchase still removes all of that. The building, the district, the tenure, the lease and the entry cycle are common to both sides, and only the floor differs.
The storey effect on annualised return survives at -0.0221 points a year, and it survives every split we ran:
| Split | Per storey | t |
|---|---|---|
| Core central region | -0.0213 | -4.9 |
| Rest of central region | -0.0295 | -7.2 |
| Outside central region | -0.0095 | -1.7 |
| Freehold | -0.0258 | -6.1 |
| 99-year lease | -0.0205 | -6.0 |
| Sold in 2024 | -0.0208 | -4.7 |
| Sold in 2025 | -0.0238 | -5.4 |
Outside the central region the effect is small and not statistically distinguishable from zero, which is what you would expect if height is paid for mainly where there is a view to pay for.
Then the finding that matters. Add one more control, for how dear each unit was per square foot relative to its own project and purchase year, and the storey coefficient collapses to -0.0007 points a year, with a t-statistic of -0.3. It disappears. In the same regression, being dear relative to your own project and year costs 4.68 percentage points a year per log point of entry price.
The floor, in other words, is not a bad asset. A high floor earns a lower return only to the extent that the buyer paid a premium per square foot for it, and premiums paid inside a project do not come back. That is the same pass-through we measured when ranking entry prices within a project, now attached to the specific thing buyers are being asked to pay extra for.
It is also the opposite reading of height from the HDB market, where the within-block storey premium has been compressing. Private buyers are not mispricing height because the premium is shrinking. They are paying a premium the resale market has never fully honoured.
What this analysis does not prove
It does not prove a high floor is a poor purchase. It measures resale return per dollar, and says nothing about the view, the noise, the light or the privacy, which are the reasons most buyers want height and are not captured in a transaction record.
It does not prove that paying less for height would have produced a better result, because the discount a low floor trades at is itself set by the same market. Nor does it establish causation: the association between storey and return is consistent and survives the splits, but a persistent pattern in registered transactions is not a market law, and the collapse of the coefficient under an entry-price control is evidence about the channel, not proof of it.
Returns are measured price to price on the same unit and exclude rent, financing and interest, stamp duties, maintenance, property tax, agent commission, renovation and all transaction costs. They are observed only on units that actually sold, so they understate the experience of owners still holding at a loss, a survivorship effect that applies equally to both floor bands.
The dollar table is an illustration built from the controlled per-storey figures applied to the sample's median return, not a transaction we observed.
What this means for a buyer or a seller
If you want the high floor for the view, buy the high floor. Nothing here argues against it, and 0.20 points a year is a reasonable price for something you look at every day.
If you are buying for return, the stack is a weaker lever than it is sold as, and the premium is where the decision actually sits. The question is not "which floor holds value" but "is the premium on this floor the project's going rate or a markup on top of it". Those are answered by what the project's floor bands have transacted at, not by the pricing sheet.
If you are selling a high floor, the arithmetic is worth knowing before you set a price. The market has historically returned about three-fifths of a storey premium, so a listing priced as though height compounds is likely to buy time on the market rather than a higher price.
Next step
Before you commit to a stack, get the one table that settles it: what each floor band in that specific project has actually transacted at, against the premium you are being quoted. A quoted premium and a transacted premium are different numbers, and only the second one is yours to keep.
Send us the project name and the two units you are weighing, with floor and asking price, or run the project yourself on the Resale Price Check.
Sample: 8,057 same-unit repeat sales of private condominium units across 2,321 project-and-purchase-year groups containing at least two different floors, drawn from 13,536 repeat sales carrying a usable floor number in TRIBE's own transaction dataset, with sales registered between 1 January 2024 and 29 May 2026 and purchases from 1995 onward. The dataset records up to 40 recent profitable and 40 recent loss-making resales per project; 245 projects whose records are truncated inside this window were excluded so the sample is not conditioned on recency. Executive condominiums, landed homes and HDB flats are excluded. Entry and exit premiums are from within-group regressions of log price per square foot on floor, bedroom count and log floor area; return regressions add holding period and year of sale. Standard errors are conventional, not clustered, so t-statistics should be read as indicative. Annualised returns are price to price on the same unit and exclude rent, financing and interest, stamp duties, maintenance, property tax, agent commission, renovation and all transaction costs. Figures are medians unless stated. This article is general information about market data and not advice on any particular property or transaction.
Your next step
Choosing between two stacks in the same project? Send us the project and both units, with floor and asking price. We will show what each floor band has transacted at there, so you can see if the premium you are quoted is the market's or the seller's.
A consultant replies on WhatsApp. No registration, no obligation.
Prefer a personal read on your situation? Arrange a consultation →Keep reading
21 November 2026Private Property Market
No Discount for the Fourth Floor. Moving One Storey Up to Avoid It Costs 0.67%.
20 November 2026Private Property Market
The Two-Year Run Does Not Carry. The Ten-Year Record Is Worth 3.5 Points.
17 November 2026Private Property Market
Tenure Is 10% of the Score and 51% of What the Market Pays
Next step
TRIBE Research
Written with AI assistance from TRIBE's own data and the public sources listed, then checked against them. General information, not financial advice. How we write
Data as of May 2026.
How TRIBE scores and checks its analysis
Spotted an error, or a figure that has moved since publication? Tell us and we will correct it.
General information only, not financial, investment, legal or tax advice. It does not consider your own circumstances; check your own numbers before you commit.