Insights
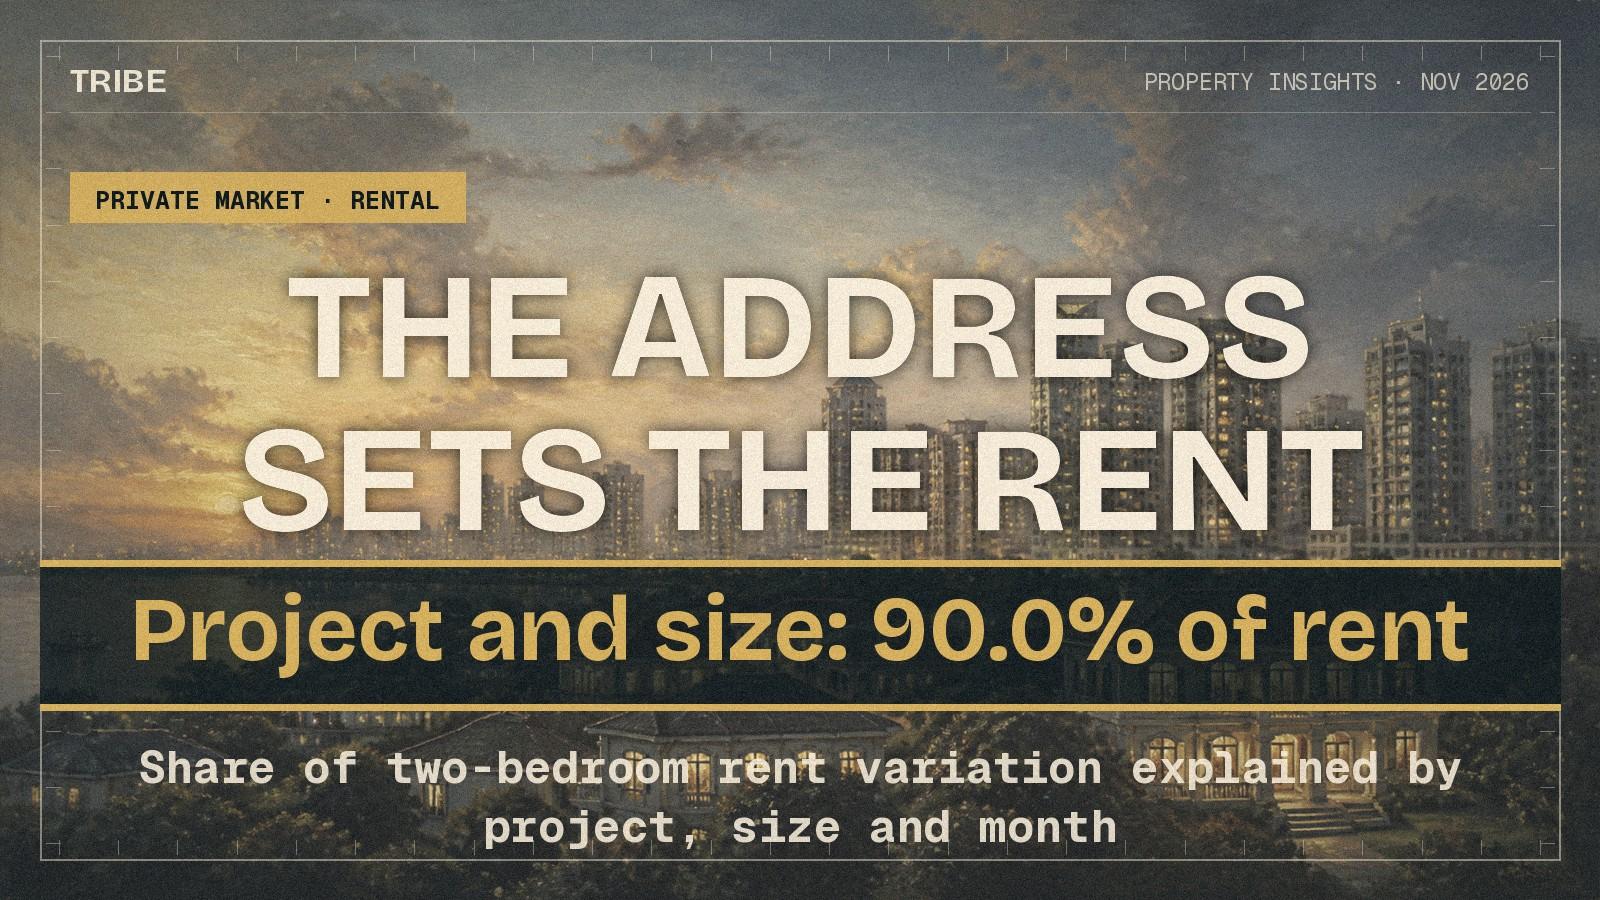
Project and Size Explain 90.0% of a Condo's Rent. The Unit Itself Moves It 7.1%.
Across 50,394 private lettings in the twelve months to May 2026, the project, the recorded floor area and the month of signing explain 90.0% of what a two-bedroom condo lets for. Compare lettings alike on all three and the middle half sit within 5.4% of each other.
By TRIBE Research · 12 November 2026 · 9 min read
Written before the November 2026 RPS methodology revision, which changed the factor weights and moved grades to fixed score bands. Weights, scores and grades quoted here are as they stood then; see the current scorecards and the current weights.
The decision
- Who this is for
- Condo owners about to re-let a unit, and buyers projecting rental income before they buy
- The question
- How much can I lift the rent on my own unit?
- The short answer
- Less than a listing page suggests. Compare lettings in the same project, with the same bedroom count and the same recorded floor area, signed in the same month, and the middle half sit within 5.4% of each other, with 7.1% between the median letting and the top tenth. Those three things explain 90.0% of the rent.
- Next step
- Before committing to a renovation, get the rent band your own project and unit size have actually been achieving, and price the upside against the spend.
The numbers behind it
- 90.0%Share of two-bedroom rent variation explained by project, size and month
- 5.4%Width of the middle half of lettings alike on project, size and month
- 1.76xDearest to cheapest tenth of two-bedroom project median rents
A landlord preparing to re-let asks what the unit could fetch with new flooring, fresh paint and better photographs. Across 50,394 private condominium lettings registered in the twelve months to May 2026, that is the smallest of the three questions that set a rent. Among two-bedroom lettings, the project, the recorded floor area and the month of signing explain 90.0% of the variation in rent.
Everything particular to the unit has to fit inside what is left. Measured directly, the gap between a typical letting and the top tenth of lettings in the same project, at the same size and in the same month, is 7.09%. On the median two-bedroom rent of $4,000 a month, that is $283.
The question in front of a landlord
The decision is not whether a renovated unit rents for more than a tired one. It is how much more, and whether the gap covers the spend before the next tenant resets the clock.
That question needs a like-for-like comparison, and a project's own letting history looks encouraging until you build one. The range of rents inside a single development is wide, which reads as room to push. Most of that width turns out to be the building letting different homes, not the same home at different prices.
The answer in plain language
The rent is bought, not earned. Which project you own and how large the unit is do almost all of the work, and the month you sign adds a little. Those three together explain 90.0% of what a two-bedroom unit lets for, across 6,976 lettings in 1,648 project, size and month groups.
What is left for the floor, the facing, the furnishing, the condition, the photographs, the agent and the negotiation is a band of about 7%. Among lettings alike on project, bedroom count, recorded size and month, the middle half sit within 5.41% of each other, and the tenth percentile to the ninetieth spans 1.099 times.
That band is real money on a large unit, and it is worth competing for. It is not a lever that changes the economics of a purchase.
The strongest supporting numbers
Measured within each bedroom count, the share of the variation in rent explained by project, recorded floor area and month of signing:
| Bedrooms | Lettings | Spread in rent | Spread left over | Explained |
|---|---|---|---|---|
| One | 5,019 | 19.24% | 6.28% | 89.3% |
| Two | 6,976 | 22.72% | 7.19% | 90.0% |
| Three | 5,800 | 31.32% | 8.36% | 92.9% |
| Four | 629 | 46.69% | 7.89% | 97.1% |
The spread columns are standard deviations of log rent, which read as proportional differences. The pattern is the same at every size, and it tightens as units get larger, because a four-bedroom market is a smaller and more homogeneous set of addresses.
The two levers that do move a rent, measured the same way:
| Lever | Effect on rent | Measured |
|---|---|---|
| Project, cheapest to dearest tenth of two-bedroom medians | 1.76x, a gap of $2,500 a month | 679 projects with 8 or more lettings |
| Project, cheapest to dearest tenth of three-bedroom medians | 2.12x, a gap of $4,500 a month | 709 projects |
| Each extra 100 square feet, two-bedroom | +4.13% | Same project, same month |
| Each extra 100 square feet, three-bedroom | +3.21% | Same project, same month |
A two-bedroom unit in a tenth-percentile project let for a median $3,300 a month over the year, and one in a ninetieth-percentile project for $5,800. That single choice, made once at purchase, is worth more than eight times the 7.09% a landlord can chase afterwards.
Rents themselves barely moved. Comparing lettings in the same project, at the same size and the same bedroom count, rents signed in May 2026 were 1.07% above those signed twelve months earlier, with no trend after the first quarter of the window.
Why a project's own letting range misleads
The obvious check is the range of rents a development has recently achieved. Inside the 827 projects with at least 20 lettings in the window, the highest rent was a median 2.05 times the lowest, and the tenth to ninetieth percentile still spanned 1.49 times.
A 105% gap between the cheapest and dearest letting in one building looks like an invitation to ask for more. It is almost entirely the building letting different things. A development with one-bedroom and four-bedroom stacks lets both, at $3,100 and $8,600 median rents nationally, and those appear in the same range. Size and bedroom count are doing the work that the range appears to credit to negotiation.
| Comparison, same twelve months | Tenth to ninetieth percentile |
|---|---|
| All lettings in the same project | 1.49x |
| Same project, bedroom count, recorded size and month | 1.099x |
The controlled comparison
Narrowing to lettings that are genuinely alike removes the illusion. Within a single project, a single bedroom count, a single recorded floor area and a single month, 4,660 two-bedroom lettings across 876 groups sit in this band around their group's median:
| Position in the group | Rent against the group median | On a $4,000 rent |
|---|---|---|
| Tenth percentile | -6.45% | $3,742 |
| Twenty-fifth | -2.78% | $3,889 |
| Seventy-fifth | +2.63% | $4,105 |
| Ninetieth | +7.09% | $4,283 |
The middle half of lettings are separated by 5.4% of the rent, or $216 a month. Getting from the middle of your own group to the top tenth is worth $283 a month, or $3,402 a year.
The result holds across windows. Measured over six months the explained share is 90.1%, over twelve months 90.0%, over twenty-four months 87.7%. Restricted to the 227 two-bedroom lettings in projects whose records are not truncated at all, it is 91.1%.
What the analysis does not prove
It does not prove that a renovation is worth nothing. It bounds what unit-level factors can be worth in this data, and that bound is generous rather than tight.
Floor area is recorded in 100 square foot bands, so two units in the same band can differ by nearly 100 square feet. At 4.13% per 100 square feet, size alone could account for a large part of the 7.19% that is left. The room for condition and furnishing is smaller than 7.09%, not larger.
Nor does it isolate renovation from anything else. The 7.09% between the median and the top tenth also contains the storey, the facing, the view, the furnishing, the lease length, the tenant's circumstances and ordinary luck. Several of those cannot be bought at any price.
The dataset records rents, not properties. It carries no field for condition, furnishing, renovation date or lease term, so this is an upper bound on their combined effect and not a measurement of any one of them. A persistent pattern in registered lettings is not a market law, and the relationship between an address and a rent is an association, not proof that the address causes it.
Rents are gross contractual rents. They exclude property tax, maintenance and sinking fund, agent commission, income tax, vacancy between tenancies, repairs and the cost of the furnishing itself, all of which fall on the landlord and none of which are in these figures. The file retains up to 120 recent lettings per project, so 106 projects whose records truncate inside the twelve-month window were excluded to keep the sample from being conditioned on recency.
What this means for a landlord or a buyer
If you own the unit already, the band is the realistic target and the spend has to fit inside it. A $30,000 renovation that lifted a median two-bedroom to the top tenth of its own group would earn $3,402 a year and take 8.8 years to repay, and it would be claiming credit for a storey and a facing it did not change. Presentation, accurate pricing and a short vacancy are worth pursuing because they are cheap, not because they are powerful.
If you are still choosing what to buy, the rent is decided here. A project at the dearer end of its bedroom class lets for 1.76 times one at the cheaper end, and every extra 100 square feet adds 4.13%. Those are the only two levers in the data with real force, and both are set on the day you sign.
If you are reading a rental projection, check which number it leans on. A projection built on a project's average letting is a reasonable estimate for a unit of ordinary size in that project. One built on the project's best recent letting is borrowing a storey, a size and a month that may not be yours.
This is the same shape we found in the rental yield factor in our own scorecard, and the same conclusion the HDB market gives, where the highest-yielding flats are simply the cheapest ones. Rent follows the address far more closely than it follows effort.
Next step
Before you spend on a renovation, get the band first. For your project, bedroom count and unit size, the useful figures are the median recent letting, the top tenth, and how many lettings those rest on. Then price the renovation against the gap, not against the best number on a listing page.
Send us the project, the bedroom count and the unit size, or look the project up on the Resale Property Scorecard, which carries its recent letting record.
Sample: 50,394 private residential lettings across 1,947 projects, registered in the twelve months from June 2025 to May 2026, drawn from 252,913 lettings in TRIBE's own rental dataset. The file retains up to 120 recent lettings per project in date order; 106 projects whose records truncate inside the window were excluded so the sample is not conditioned on recency. Explained shares are one minus the ratio of residual to total variance of log rent, with groups formed on project, recorded floor area and month of signing, restricted to groups of three or more lettings. Floor area is recorded in 100 square foot bands. Executive condominiums, landed homes and HDB flats are not separated out. Rents are gross contractual rents and exclude property tax, maintenance and sinking fund, agent commission, income tax, vacancy, repairs and furnishing cost. Figures are medians unless stated. This article is general information about market data and not advice on any particular property or tenancy.
Your next step
About to re-let a condo unit and weighing a renovation first? Send us the project, the bedroom count and the unit size. We will show you the rent band your own project has been achieving, and what the top tenth of those lettings looked like.
A consultant replies on WhatsApp. No registration, no obligation.
Prefer a personal read on your situation? Arrange a consultation →Keep reading
21 November 2026Private Property Market
No Discount for the Fourth Floor. Moving One Storey Up to Avoid It Costs 0.67%.
20 November 2026Private Property Market
The Two-Year Run Does Not Carry. The Ten-Year Record Is Worth 3.5 Points.
17 November 2026Private Property Market
Tenure Is 10% of the Score and 51% of What the Market Pays
Next step
TRIBE Research
Written with AI assistance from TRIBE's own data and the public sources listed, then checked against them. General information, not financial advice. How we write
Data as of May 2026.
How TRIBE scores and checks its analysis
Spotted an error, or a figure that has moved since publication? Tell us and we will correct it.
General information only, not financial, investment, legal or tax advice. It does not consider your own circumstances; check your own numbers before you commit.