Insights
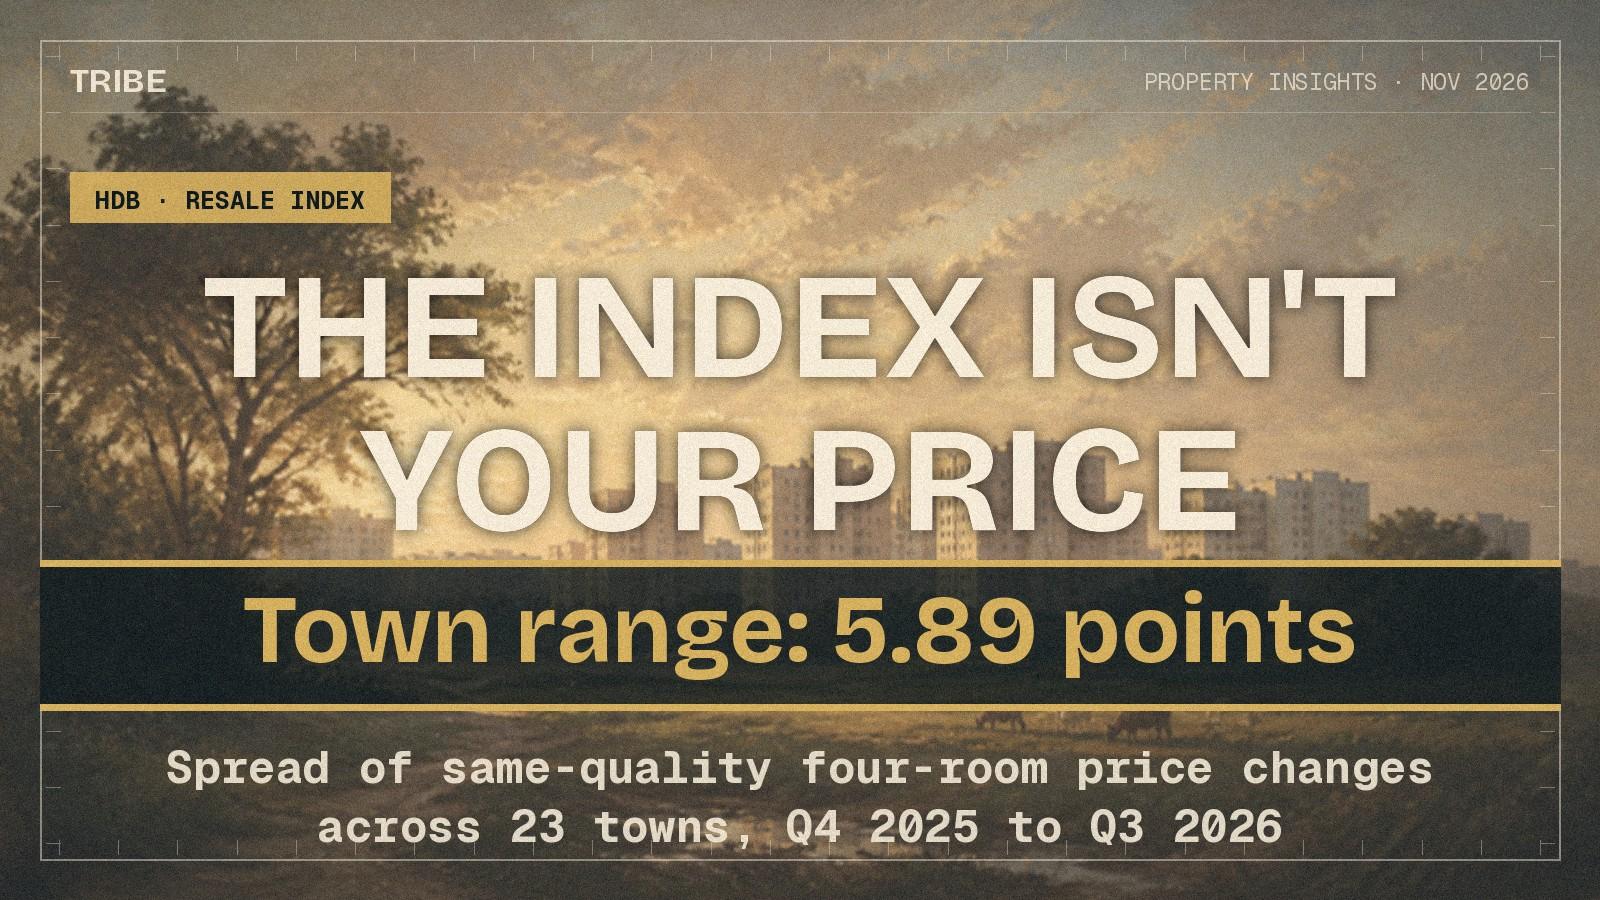
The HDB Index Fell 0.54%. Matched Four-Room Prices Span 5.89 Points by Town.
HDB's resale index has fallen three quarters running, to 202.5. Across 5,379 four-room resales, holding size, lease, storey and town still, the market price fell 0.28% — the index is right. But the same-quality price moved across 5.89 points between towns, and the unadjusted town median overstates Clementi's move by 9.92 points.
By TRIBE Research · 7 November 2026 · 7 min read
The decision
- Who this is for
- HDB flat owners asked to cut their price because the national index fell again.
- The question
- Does a falling resale price index mean my flat is worth less?
- The short answer
- The index is honest about the market and almost silent about your flat. Holding size, lease, storey and town still, the market four-room price fell 0.28% over the three quarters while the index fell 0.54%. But the same-quality change ranged across 5.89 points by town, from Geylang up 3.65% to Jurong East down 2.24%. Your town and flat type decide your number, not the index.
- Next step
- Get your own flat's matched price from recent sales in your block and lease band before you move your asking price.
The numbers behind it
- 0.54%Fall in HDB's resale price index, Q4 2025 to Q3 2026
- 5.89 pointsRange of same-quality four-room changes across 23 towns
- 9.92 pointsHow far Clementi's raw median overstates its matched move
HDB's resale price index closed the third quarter of 2026 at 202.5, down from 203.6 at the end of 2025. That is a fall of 0.54% spread over three consecutive quarterly declines: 0.10%, then 0.29%, then 0.15%. It is the first sustained run of declines in about seven years, and it is being quoted back at sellers as a reason to accept less.
We recomputed the same window from the registered transactions underneath it. Across 5,379 four-room resales in the 23 largest towns, holding floor area, remaining lease, storey and town still, the same-quality price fell 0.28%. The index is telling the truth about the market. What it cannot tell you is your number: the same-quality change ranged across 5.89 percentage points between towns.
The seller's question
A buyer's agent opens with the index. Three quarters down, the papers agree, so the offer comes in under your asking price and the argument for it is national. The question is narrow and practical: does a 0.54% fall in a national index say anything about what your flat should fetch?
The answer in plain language
It says something about the market and very little about your flat. The market-wide number we compute, 0.28% down on a same-quality basis, sits close to the index and confirms it. But the spread around that average is roughly eleven times its size. A seller in Geylang and a seller in Jurong East are in the same index and in opposite markets.
The strongest supporting numbers
We used every registered resale from January 2017 to November 2026 — 244,312 transactions — and compared the fourth quarter of 2025 with the third quarter of 2026, keeping only the 23 towns with at least 30 four-room sales in both quarters.
The comparison is a price model on 5,379 of those sales: log price against log floor area, remaining lease in years, storey height and town, with a separate price shift for each town between the two quarters. It explains 85.3% of the variation in price. On the way through, it prices the two things sellers argue about most: each extra year of remaining lease is worth 0.97% on a four-room, and each storey up is worth 0.72%.
| Four-room, same quality | Change, Q4 2025 to Q3 2026 |
|---|---|
| Geylang | +3.65% |
| Toa Payoh | +2.74% |
| Bedok | +2.71% |
| Woodlands | −0.01% |
| Tampines | −1.09% |
| Choa Chu Kang | −2.08% |
| Jurong East | −2.24% |
| Market, volume-weighted | −0.28% |
Eight of the 23 towns rose. Fifteen fell. Flat type splits the market again: on the same basis, three-room prices fell 1.38% while five-room prices fell 0.12%, so the smallest flats absorbed most of the decline.
Why the raw town median misleads
The obvious check is to take your town's median price per square foot and compare the two quarters. It is the number most widely published, and it is wrong in both directions, because the mix of what sold changes between quarters.
Clementi is the clearest case. Its raw four-room median rose 10.45%. Holding size, lease, storey and town still, it rose 0.53%. The unadjusted figure overstates the move by 9.92 points, because the flats that happened to sell in the later quarter were newer and higher up.
Kallang/Whampoa runs the other way. Its raw median fell 3.65%; its same-quality price rose 1.53%, a gap of 5.17 points in the opposite direction. On raw medians, 11 of 23 towns look like they rose. On matched quality, 8 did. A seller reading either number without the other is being misled by whichever flats their neighbours happened to list.
The controlled comparison
Put the two side by side and the pattern is consistent rather than random. The raw median overstates the move wherever newer or higher stock came to market, and understates it wherever the quarter's sales skewed older or lower.
| Town | Raw median change | Same-quality change | Gap |
|---|---|---|---|
| Clementi | +10.45% | +0.53% | +9.92 |
| Queenstown | +7.79% | +2.67% | +5.12 |
| Bukit Merah | +1.01% | −1.65% | +2.66 |
| Hougang | −3.93% | −0.04% | −3.89 |
| Kallang/Whampoa | −3.65% | +1.53% | −5.17 |
The index itself is built to avoid exactly this problem, and our same-quality figure agreeing with it to within 0.26 points is the evidence that it does. The index is not the number that misleads. The town median is.
What this does not prove
It does not prove your flat follows your town. A town-level shift is still an average over blocks, stacks and lease bands that can disagree as sharply as the towns do, and we did not model your block.
It does not establish a cause. We measured what prices did, not why; the three-quarter decline overlaps the removal of the 15-month wait-out period in July 2026 and a volume increase from 5,020 sales in the fourth quarter of 2025 to 7,404 in the third quarter of 2026, and this comparison cannot separate those.
Three quarters is a short window, and 0.28% is small enough that sampling noise in a single town matters. Towns with fewer than 30 sales in either quarter are excluded for that reason. All figures are price-to-price on registered resale prices and exclude agent commission, legal fees, stamp duty paid by the buyer and any cash-over-valuation history. A pattern across three quarters is not a forecast and not a law.
What this means for a seller
If you are in Geylang, Serangoon, Toa Payoh, Bedok or Queenstown, the national index is an argument against you and the matched evidence is not. Those five towns rose between 2.67% and 3.65% on a same-quality basis while the index fell.
If you are in Choa Chu Kang, Sengkang or Jurong East, the index understates your position: those towns fell roughly four to eight times as far as the market. And if your flat is a three-room, the decline is real and larger than the headline, wherever you are.
The practical move is to stop negotiating against a national number in either direction. The comparison that decides your price is recent sales in your own block and lease band, adjusted for the storey you are on.
Your next step
Put your own flat through the matched comparison before you move your price. Our Resale Price Check prices a flat from recent sales in its own block and lease band rather than its town median, which is the gap this article measures. If you want us to run it with you, send your block, flat type and remaining lease.
Sample: 244,312 registered HDB resale transactions, January 2017 to November 2026, from data.gov.sg; the controlled comparison uses 5,379 four-room resales in the 23 towns with at least 30 such sales in both the fourth quarter of 2025 and the third quarter of 2026. Index figures are HDB's published Resale Price Index. Price model: log price against log floor area, remaining lease, storey and town, with a per-town shift between quarters, R-squared 0.853. Figures are price-to-price and exclude agent commission, legal fees, buyer's stamp duty and renovation. General information, not financial advice.
Your next step
Being asked to cut your price because the index fell? Send us your block, flat type and remaining lease, and we will show what matched sales in your own stack and lease band actually did.
A consultant replies on WhatsApp. No registration, no obligation.
Prefer a personal read on your situation? Arrange a consultation →Keep reading
Next step
TRIBE Research
Written with AI assistance from TRIBE's own data and the public sources listed, then checked against them. General information, not financial advice. How we write
Sources
- HDB Resale Price Index, 1990-Q1 to 2026-Q3 · Housing & Development Board · retrieved 6 November 2026
- Resale Flat Prices (registered transactions, Jan 2017 onwards) · Housing & Development Board · retrieved 6 November 2026
- Flash Estimate of 3rd Quarter 2026 Resale Price Index and Upcoming Flat Supply · Housing & Development Board · retrieved 6 November 2026
Data as of November 2026.
How TRIBE scores and checks its analysis
Spotted an error, or a figure that has moved since publication? Tell us and we will correct it.
General information only, not financial, investment, legal or tax advice. It does not consider your own circumstances; check your own numbers before you commit.