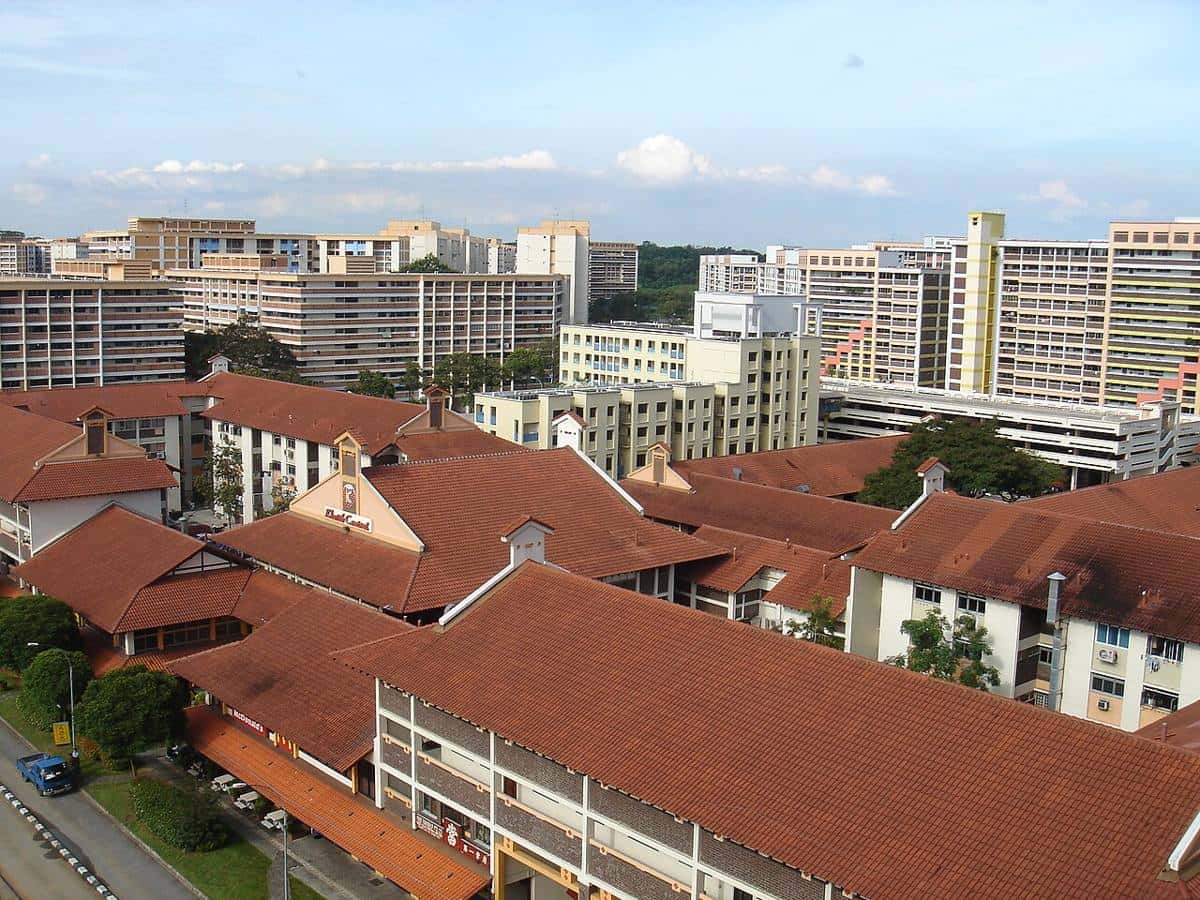
Industrial building
Ark@Gambas
Factory · District 27 · 45 of 60 years left · 7 Gambas Crescent, Singapore 757087
Median $465 psf over the 12 months to Oct 2026, from 80 sales on file. Latest: $1,380,000 for 3,315 sq ft in Sept 2026.
- Lease left, 60-year title
- 45 yrs
- Sales, 12 months to Oct 2026
- 14
- To Sembawang
- 890 m
Background: District 27, not this building. Photo credits
Ark@Gambas · 12 months to Oct 2026 Prices
- Median psf
- $465
- Median price
- $1.33M
- Typical size, sq ft
- 3,315
- Unit sales
- 14
By size
| Sales | Median price | Psf | |
|---|---|---|---|
| 1,000 to 1,999 sq ft | 5 | $830k | $476 |
| 2,000 to 4,999 sq ft | 9 | $1.4M | $422 |
By floor
| Sales | Median price | Psf | |
|---|---|---|---|
| Ground floor | 9 | $1.4M | $422 |
| Levels 2 to 5 | 1 | $950k | $482 |
| Levels 6 to 10 | 4 | $805k | $475 |
39 of 49 sellers with a known purchase price sold for more than they paid; the median made $66k, 0.9% a year.
80 sales Past transactions
80 sales, Oct 2021 to Oct 2026
| Type | Lease left | Sale | |||||
|---|---|---|---|---|---|---|---|
| 4 Sep 2026 | Factory | 1 | 3,315 | $1,380,000 | $416 | 45 yrs | Resale |
| 31 Jul 2026 | Factory | 6 | 1,711 | $848,000 | $495 | 46 yrs | Resale |
| 10 Jul 2026 | Factory | 1 | 3,315 | $1,400,000 | $422 | 46 yrs | Resale |
| 1 Jul 2026 | Factory | 1 | 3,315 | $1,400,000 | $422 | 46 yrs | Resale |
| 29 May 2026 | Factory | 1 | 3,315 | $1,388,000 | $419 | 46 yrs | Resale |
| 28 May 2026 | Factory | 5 | 1,970 | $950,000 | $482 | 46 yrs | Resale |
| 4 May 2026 | Factory | 8 | 1,604 | $760,000 | $474 | 46 yrs | Resale |
| 23 Feb 2026 | Factory | 1 | 3,315 | $1,668,000 | $503 | 46 yrs | Resale |
| 23 Feb 2026 | Factory | 1 | 3,315 | $1,625,000 | $490 | 46 yrs | Resale |
| 23 Jan 2026 | Factory | 1 | 3,315 | $1,290,000 | $389 | 46 yrs | Resale |
URA Realis caveats via Huttons, to 6 Oct 2026. Check the yield on one unit →
District 27 Nearby buildings
- North Link BuildingFactory · 33 of 60 years left$278 psf
- North Spring BizhubFactory · 44 of 60 years left$585 psf
- Harvest @ WoodlandsFactory · 43 of 60 years left$530 psf
- North Point BizhubFactory · 43 of 57 years left$488 psf
- A'posh BizhubFactory · 44 of 60 years left$682 psf
- Proxima@GambasFactory · 18 of 30 years left$253 psf
- E9 PremiumFactory · 17 of 30 years left$218 psf
- Win 5Factory · 15 of 26 years left$296 psf
Notes: how these figures are worked out
- Prices: URA Realis caveats via Huttons, 15 Nov 2021 to 6 Oct 2026. Medians use units sold one by one; a whole floor or several units under one caveat is listed but left out of the medians. The tiles, size and floor tables cover the 12 months to Oct 2026.
- The trend plots the median psf per half-year from two sales up; the district line is every unit sale of that type in the district, from eight sales up. A median moves with which units sold (floor, size, ground-floor shops), so a thin half-year can swing.
- Profit is the sale price less the seller’s own purchase price, as the caveat pairs them, before stamp duty, GST and fees; “a year” is that gain as a yearly rate over the time held. Unit numbers are left out.
- Lease left is in whole years on the day of sale, from the lease start on the caveat.
- Address and map point: OneMap (SLA) search for the building’s name, kept where its postal district matches the caveats.