Insights
Private Rose, HDB Fell — Three Quarters Running. That Has One Precedent.
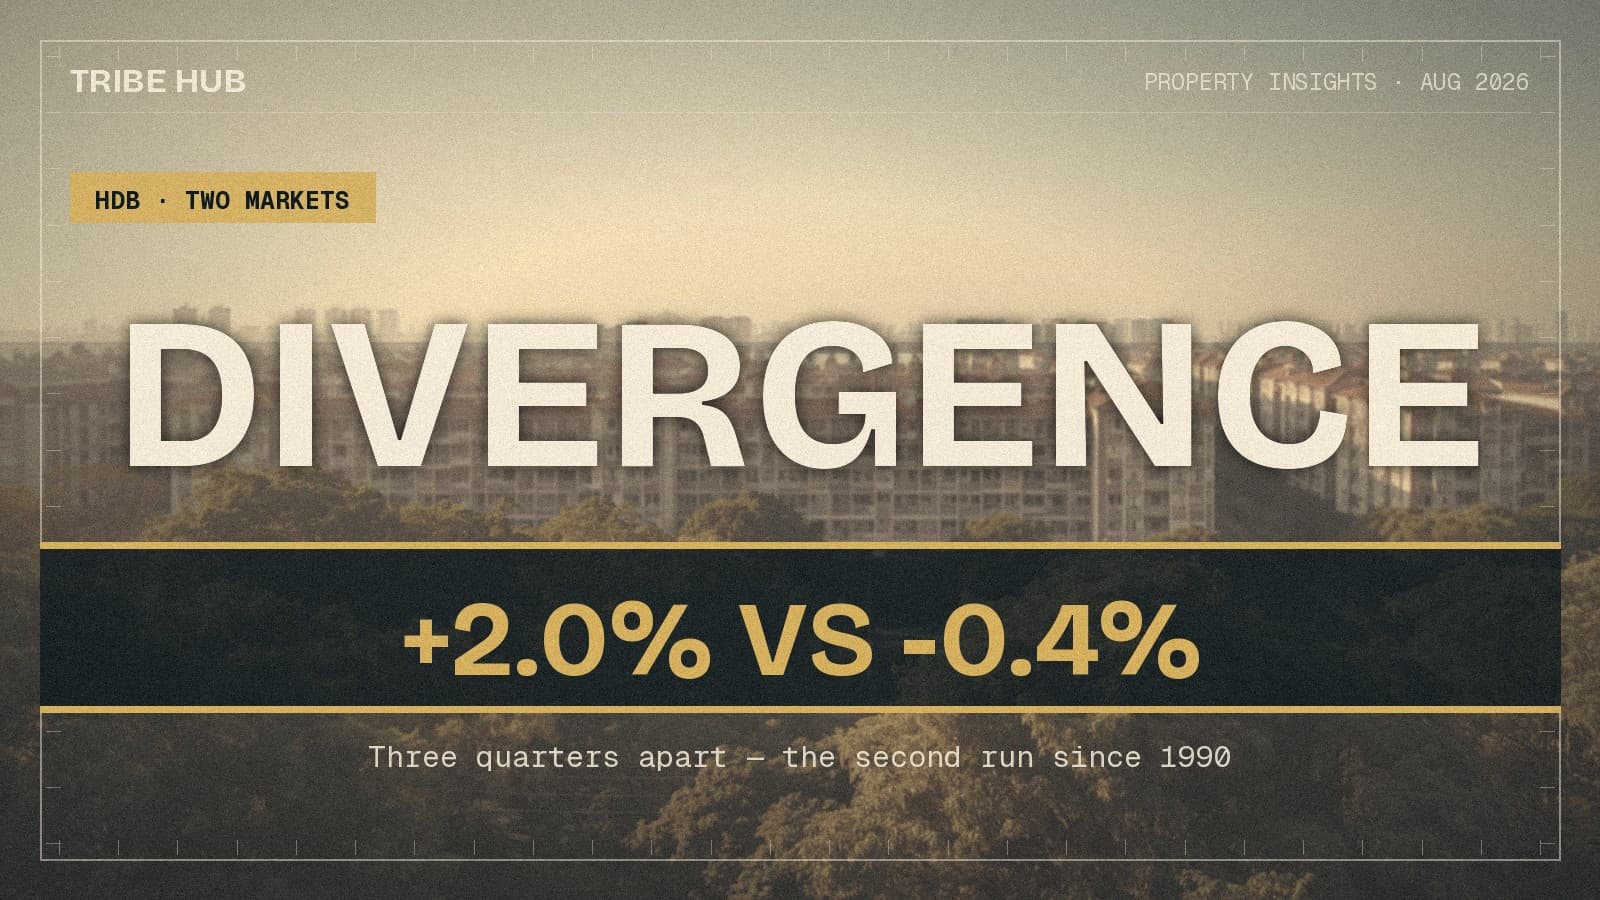
The private index has climbed for three straight quarters while HDB resale eased — only the second such run since the HDB series began in 1990. The last one, in 2017, opened a 12.6-point gap in two years. What the split does to an upgrader's bridge, computed.
By TRIBE Editorial · 28 August 2026 · 6 min read
Huttons' data team asked this week whether the HDB market has decoupled from private property. Put the two official indices side by side and the question sharpens into something more specific: for three consecutive quarters — 4Q2025, 1Q2026, 2Q2026 — the private residential index has risen while the HDB Resale Price Index has fallen. Since the HDB series began in 1990, a split in that direction has lasted three straight quarters exactly once before.
That precedent is worth taking seriously, because of what it did next.
Two indices, opposite signs
Computed from the URA private residential property index and the HDB Resale Price Index, both quarterly:
| Quarter | Private (all residential) | HDB resale |
|---|---|---|
| 3Q2025 | +0.9% | +0.4% |
| 4Q2025 | +0.6% | −0.0% |
| 1Q2026 | +0.9% | −0.1% |
| 2Q2026 | +0.5% | −0.3% |
From the HDB index's 3Q2025 peak to 2Q2026, private is up 2.0% and HDB resale is down 0.4% — a 2.44-percentage-point wedge in nine months. Quarters where the two series carry opposite signs in this direction are genuinely rare: 16 out of 145 since the HDB series began. And the direction can flip — as recently as 3Q2024, the mirror image happened, with private falling 0.7% in a quarter where HDB resale rose 2.7%.
One refinement matters before anyone prices a decision off that table. The private headline is being carried disproportionately by landed property — a pattern we flagged when the 2Q number landed. Strip landed out and the non-landed index — the condo an upgrader actually buys — rose 1.0% over the same three quarters, not 2.0%. The wedge against the flat-seller is real, but for a condo-bound upgrader it is roughly half the headline's size.
What the one precedent did
The last sustained split ran 3Q2017 through 1Q2018, and it opened a gap that kept widening long after the streak itself ended. Private prices bottomed in 2Q2017 and climbed; HDB resale kept easing for two more years, to 2Q2019. Over those eight quarters the private index rose 10.4% while HDB resale fell 2.2% — a 12.6-point divergence, against the current episode's 2.4 points so far.
Huttons' caveat analysis of that period holds a second lesson: the gap did not stop upgraders. Buyers with HDB addresses held a roughly stable 40% share of private purchases through 2017–2019 — what actually cut volumes was the July 2018 ABSD hike, which keyed off property count, not address. The divergence changed the price of upgrading, not the population doing it.
The longer arc runs the other way
Zoom out and the current split is a turn, not a continuation. From 2Q2019 to 3Q2025, HDB resale rose 55.7% against private's 42.6% — six years of the public market closing the gap on the private one. Set both indices to 100 at 1Q2009 and the ratio between them tells the story in one line: private peaked at 1.15 times HDB in 2019, was ground down to 1.06 by 3Q2025, and has ticked back up to 1.08 over the past three quarters.
So a seller who feels the ladder stretching is feeling nine months of movement, not a decade's. Since the start of 2016 the cumulative race is closer than the recent headlines suggest: private +56.0%, HDB resale +50.6%. The question the current episode poses is whether the 2019–2025 convergence has ended — and the honest answer is that three quarters is the minimum evidence for that claim, not proof of it. BTO supply has been deliberately ramped since 2021, which weighs on resale; pulling the other way, the removal of the 15-month wait-out period reopened a channel of private-side demand for resale flats.
The bridge, in dollars
For an upgrader, the divergence has a specific shape: the asset you are selling and the asset you are buying are on opposite escalators. Take a pair that tracked the indices exactly from 3Q2025 — a flat worth S$850,000 then, and a target resale condo at S$1,600,000:
| 3Q2025 | 2Q2026 | Change | |
|---|---|---|---|
| Flat (tracks HDB RPI) | S$850,000 | S$846,244 | −S$3,756 |
| Condo (tracks non-landed index) | S$1,600,000 | S$1,616,115 | +S$16,115 |
| Bridge to cross | S$750,000 | S$769,871 | +S$19,871 |
Nine months of waiting cost this upgrader S$19,871 — about S$2,200 a month — before transaction costs, and roughly S$35,700 if their target tracked the all-residential index instead. Replay the 2017–2019 precedent on the same pair and the bridge widens by S$184,762 over two years. That is the scenario the precedent puts on the table: not a crash on either side, just a gap that compounds quietly while a seller waits for a better flat price that the index says is not coming.
Two cautions cut the other way. First, these are index-tracked abstractions — your flat's actual price is set by your block's last few transactions, which can beat the index or trail it. Second, the bridge is not financed dollar-for-dollar with cash: the sequencing of the sale and purchase and how much of the paper gain is actually extractable decide what a wider gap costs you at completion, and those mechanics move more money than three quarters of index drift.
Which clock is yours
If you own a flat and have no intention of leaving the HDB market, the divergence is close to irrelevant — your comparison set is other flats, and that market has eased 0.4% from its peak. If you are upgrading, the two clocks now run in opposite directions for the first time since 2018, and waiting has a computable monthly price. And if you are deciding whether this is 2017 all over again: the one precedent ran for two years, but it started from a private market that had just corrected 12% over four years. This one starts from a private index at its all-time high. The label "decoupling" fits the last three quarters. Whether it fits the next eight is the S$185,000 question.
Sources: index figures computed from the URA private residential property price index (1975–2Q2026) and the HDB Resale Price Index (1990–2Q2026), both via data.gov.sg; quarterly changes are quarter-on-quarter, and "divergence" counts quarters where the private index rose while the HDB index fell. Upgrader-share and 2017–2019 caveat analysis as reported by Huttons Asia via EdgeProp, 27 August 2026. Worked bridge figures assume prices track the respective indices exactly and exclude transaction costs. This article is general information, not financial advice.
Know what you can afford
Loan, stamp duty, CPF, and monthly repayments — work out your real budget before you commit. No registration required.
Plan my purchase →Prefer a personal read on your situation? Arrange a consultation →Keep reading
Next step

TRIBE Editorial · Reviewed by Silas Tan
Co-Founder, TRIBE · District Director, Huttons Asia · Ex-Mortgage Banker (AVP) · >1,000 families advised · CEA R000303I
How TRIBE scores and checks its analysis
Spotted an error, or a figure that has moved since publication? Tell us and we will correct it.
This article is for informational purposes only and does not constitute financial or investment advice.