Insights
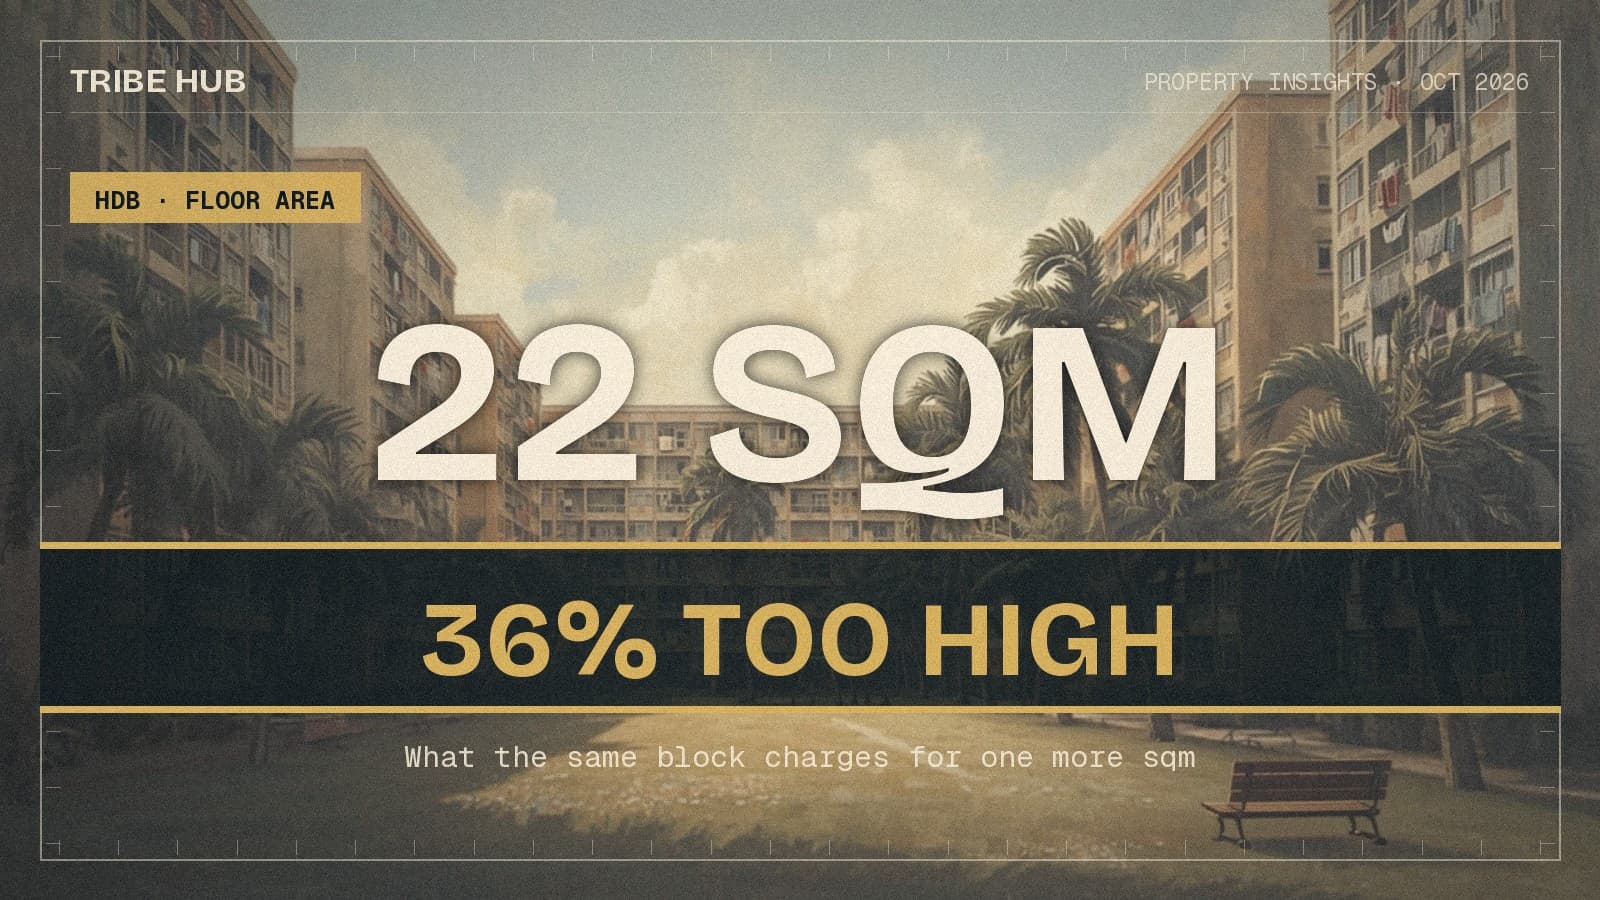
The Headline Price Per Square Metre Is 36% Above the Square Metre You Actually Buy.
Holding the block, the flat type and the year fixed, one extra square metre adds 0.79% to an HDB resale price — about $4,986 on the median four-room flat, against a headline $6,774. The gap has widened from 1.21 to 1.36 times since 2017-19.
By TRIBE Editorial · 9 October 2026 · 13 min read
In September we showed that a four-room flat shrank 15 square metres between the 1995 and 2021 cohorts, and priced that lost space at roughly $66,000 on the median flat. That was a comparison across vintages, fitted across the whole market.
This is the tighter version of the same question. Hold the block fixed — same building, same flat type, same calendar year — and ask what the resale market charges for one more square metre. The answer is 0.7914% of price per square metre, about $4,986 on today's $630,000 median four-room flat.
The headline number a buyer actually sees is $630,000 divided by 93 square metres: $6,774 per square metre. That is 36% higher than the square metre they are buying at the margin, and the gap has been widening.
What is being compared
Every transaction is grouped by block, street, flat type and year, and only groups with at least three sales contribute. Price and floor area are both demeaned inside the group, so the only variation used is the same flat type, in the same building, in the same calendar year, at different sizes. Town, MRT distance, lease, estate age, the market level that year — all of it is absorbed by the group.
A looser specification groups by town, flat type, lease decade and year, which keeps far more data but allows one building to be compared against another. Both are reported throughout, because they disagree in informative places.
This measures one thing: the slope of price against floor area, inside a building, and whether that slope has moved.
A four-room flat is 84 to 106 square metres
Over the last twelve complete months, the label hides a wide range of actual space.
| Flat type | n | p5 | Median | p95 | p95 − p5 | Full range |
|---|---|---|---|---|---|---|
| 2-room | 753 | 38 | 47 | 48 | 10 | 34–60 |
| 3-room | 5,761 | 59 | 67 | 77 | 18 | 52–118 |
| 4-room | 10,812 | 84 | 93 | 106 | 22 | 74–150 |
| 5-room | 5,787 | 110 | 116 | 133 | 23 | 99–153 |
| Executive | 1,531 | 130 | 146 | 163 | 33 | 125–193 |
Twenty-two square metres separate a small four-room from a large one — 26.2% more floor area under the same label, or about 237 sq ft. Executive flats span 33 square metres.
The interquartile range is much tighter than that: 92 to 101 square metres for a four-room, a spread of nine. The variety lives in the tails.
But almost never inside your block
Here is the finding that reframes the rest, and it cuts against the usefulness of the estimate.
Of the 1,448 blocks that recorded three or more four-room resales in the last twelve months, 60.4% recorded zero variation in floor area — every four-room flat that traded in that building was exactly the same size. The median within-block spread is 0.0 square metres. At the 75th percentile it is 2; at the 90th it is 5. Only the top tail reaches anything like the national 22, and the maximum observed is 26.
So the 22-square-metre spread is overwhelmingly a fact about which block you buy in, not a choice available inside one. For most buyers there is no bigger four-room in the building. The choice is between buildings — and between buildings, the price-per-square-metre comparison is contaminated by everything that differs between them, which is the original problem.
It also means the building-fixed estimate below is identified off a minority of blocks: the roughly 40% with mixed stock, which skew towards older estates where unit sizes within a block were less standardised. That is a real limit on how far the number travels, and it is stated here rather than in a footnote.
What the same building charges
| Window | Specification | Coefficient | % per sqm | t | t clustered | n | Groups |
|---|---|---|---|---|---|---|---|
| Last 12 months | Town × type × decade × year | 0.007419 | 0.7447 | 64.7 | 14.6 | 24,495 | 700 |
| Last 12 months | Block × type × year | 0.007883 | 0.7914 | 31.3 | 23.0 | 9,929 | 2,472 |
| 2017–2019 | Town × type × decade × year | 0.008125 | 0.8159 | 106.5 | 21.6 | 64,088 | 1,002 |
| 2017–2019 | Block × type × year | 0.008875 | 0.8914 | 71.8 | 37.9 | 37,071 | 8,621 |
Holding the building fixed gives a larger coefficient than holding only the town fixed, in both periods. That is the right sign for the design: if the area effect were really unobserved location quality sneaking in, tightening to a single building would shrink it, not raise it.
The premium has thinned. On the building-fixed specification it falls from 0.8914% to 0.7914% per square metre, an 11.2% relative decline. On the looser specification the fall is 8.7%. Restricted to four-room flats alone, though, the same building-fixed estimate moves only from 0.7687% to 0.7395% — a 3.8% fall that is well inside the noise. The decline is real in the pooled numbers and weak within a single flat type, which is a caveat worth carrying rather than a headline worth repeating.
The gap with the number you are quoted
Price per square metre is computed as a flat's whole price divided by its whole area. It is therefore an average, and it is doing two jobs at once: paying for the existence of a four-room flat in that town with that lease, and paying for its size. Only the second part responds when the flat gets bigger.
| Flat type | Median price | Median sqm | Headline $/sqm | Marginal $/sqm | Ratio |
|---|---|---|---|---|---|
| 3-room | $440,000 | 67 | $6,567 | $3,851 | 1.71× |
| 4-room | $630,000 | 93 | $6,774 | $4,659 | 1.45× |
| 5-room | $740,000 | 116 | $6,379 | $5,269 | 1.21× |
| Executive | $915,000 | 146 | $6,267 | $4,566 | 1.37× |
Marginal figures are the building-fixed estimate run within each flat type. On the pooled estimate across all types, the four-room marginal square metre is $4,986 against the $6,774 headline — a ratio of 1.36×, or the headline standing 35.9% above what the extra space is actually worth.
Applied to the real 22-square-metre spread, the difference is money. Naive linear pricing says those 22 square metres cost 22 × $6,774 = $149,032. The building-fixed estimate says $119,308, about 19% of price. As a ladder off the median:
| Floor area | Modelled price |
|---|---|
| 84 sqm (p5) | $586,851 |
| 93 sqm (median) | $630,000 |
| 106 sqm (p95) | $697,988 |
And the gap is widening. In 2017–2019 the median four-room sold at $403,000 across the same median 93 square metres — a headline $4,333 per square metre against a marginal $3,592, a ratio of 1.21×. Today it is 1.36×. Median price rose 56.3% over the period while the marginal square metre rose 38.8%, so the quoted figure has drifted further from the thing it appears to measure.
Diminishing returns are strong
The premium per square metre falls as the flat gets bigger. On the building-fixed specification over the last twelve months: 3-room 0.875%, 4-room 0.740%, 5-room 0.712%, Executive 0.499%. The first square metres of a flat are worth roughly twice what the last ones are.
One useful cross-reference: in the same specification and window, one extra storey is worth 0.603% of price and one extra square metre 0.769%. A floor up and a square metre more are close to the same money, which is not how most buyers weigh the two.
Where this breaks down
The building-fixed design runs out of data quickly. Raising the minimum sales per block-year cell:
| Minimum sales per cell | Coefficient | t | t clustered | n | Groups |
|---|---|---|---|---|---|
| 2 | 0.007532 | 37.6 | 26.3 | 16,465 | 5,740 |
| 3 (baseline) | 0.007883 | 31.3 | 23.0 | 9,929 | 2,472 |
| 5 | 0.008309 | 17.5 | 14.2 | 3,544 | 544 |
| 8 | 0.008045 | 6.6 | 4.5 | 1,069 | 101 |
| 12 | 0.010522 | 4.3 | 2.8 | 439 | 30 |
| 20 | 0.009647 | 0.46 | — | 65 | 3 |
The coefficient drifts upward and the sample collapses. At a minimum of 20 there are three buildings and 65 sales left, and the estimate is meaningless — the clustered standard error is undefined on three clusters. This is the point where the design runs out, not evidence against it. The looser town-level specification is flat across the entire sweep, from 0.007406 to 0.007480.
Two towns give opposite answers for the same reason. In Sengkang the coefficient is 0.000453 — effectively zero, t = 0.44 — and the four-room estimate there is mildly negative. The obvious explanation is that Sengkang four-rooms barely vary in size: a p5-to-p95 spread of 10 square metres against 22 nationally. But Punggol has even less spread, 6 square metres, and returns the largest coefficient of any major town, 1.31% per square metre. Two comparable new towns, opposite results. Where floor area barely varies, the estimate is unidentified and swings in both directions. Town-level figures from this method should be read as a range, not a league table.
The elasticity is well under one. In log-log form, a 1% larger flat fetches 0.61% more inside the same building (0.77% in 2017–2019). Nothing here supports pricing space proportionally.
Standard errors. Clustering by block multiplies the classical errors by roughly 1.4 to 4.4 times. Both are reported above. The conclusions do not change, but the t = 64.7 on the loosest specification is not a precision claim and should not be read as one.
Two specifications that move the number. Putting flat model inside the group drops the town-level coefficient from 0.007419 to 0.006693 — about a tenth of that estimate is really a flat-model effect. Excluding maisonettes, terraces, lofts, DBSS and multi-generation units (1,118 of 24,644 transactions) leaves the building-fixed estimate at 0.007908, essentially unchanged.
And the measurement itself. HDB's floor area includes recess area and space-adding items — bay windows, planter boxes, enclosed balconies — so part of the 22-square-metre spread is area a household cannot furnish. That biases the per-square-metre figure downward against the price of usable space, and the register cannot separate the two. The register also carries nothing on renovation, orientation, corner position, layout or view; a renovated flat and a stripped one look identical here.
What to do with this
If you are comparing two flats on price per square metre, the number is not measuring what it looks like. It is an average that mostly prices the flat's existence, not its size. On a four-room it overstates the marginal square metre by about 36%, and by more at the small end of the range.
If you are paying up for a larger flat of the same type, 0.79% of price per square metre is the defensible rate inside a building. On a $630,000 four-room that is roughly $5,000 a square metre, and the 22 square metres between the small and large ends of the range are worth about $111,000 to $119,000 depending on where you anchor — not the $149,000 the quoted figure implies.
If you are shopping inside one block, you probably have no size choice at all. Six in ten blocks sold only one size of four-room flat over the last year. Space is a reason to change building, which means the comparison you are actually making is contaminated by lease, town and estate age, and those swamp the square metres.
If you are selling the large unit in a mixed block, you are in the minority of buildings where this premium is collectible, and it is roughly 0.8% of price per square metre over your neighbours — real money, but less than a per-square-metre listing implies.
Method
Every figure is computed from the full register of 242,362 HDB resale transactions on data.gov.sg, January 2017 to October 2026, retrieved 8 October 2026 via the dataset's datastore_search endpoint; the retrieved row count matched the published total exactly. October 2026 held only 657 registrations at retrieval and is excluded, so the recent window is the twelve complete months from October 2025 to September 2026, 24,644 transactions in the five main flat types. The comparison window is 2017–2019, 64,194 transactions. One-room and multi-generation flats are excluded throughout, at 89 and 91 transactions across the whole series. The estimator is a within-group ordinary least squares slope of log resale price on floor area in square metres, where the group is either block, street name, flat type and year, or town, flat type, lease-commencement decade and year, and only groups with at least three transactions contribute; coefficients are converted to percent of price per square metre as exp(b) − 1. Standard errors are reported both conventionally and clustered by group. Dollar figures apply the estimated slope to that window's median four-room resale price and are a presentation of the same coefficient, not a separate estimate; because the specification is log-linear, the dollar figure scales with the flat's price and the quoted $4,986 is specific to the $630,000 median. The within-block floor-area spread is measured as the maximum minus the minimum area among four-room sales in each block over the recent window, across the 1,448 blocks with at least three such sales. Headline price per square metre is the median resale price divided by the median floor area for that flat type and window, both medians taken separately. Floor area as published by HDB includes recess area and space-adding items. The month field is registration date rather than transaction date, so the recent window covers agreements struck roughly August 2025 to August 2026, and recent months revise upward as late registrations land. Storey, where used as a control, is the midpoint of the register's three-floor band. All central tendencies are medians, never means, except where a regression requires otherwise. The September 2026 piece this builds on estimates the value of floor area across vintages using a cross-sectional hedonic on four-room transactions; this piece holds the individual building fixed and estimates a marginal slope, and the two coefficients are not directly comparable. This is general information about the resale register, not advice on any individual purchase or sale; confirm valuation, grant eligibility and loan terms with HDB and CPF before deciding anything.
Know what you can afford
Loan, stamp duty, CPF, and monthly repayments — work out your real budget before you commit. No registration required.
Plan my purchase →Prefer a personal read on your situation? Arrange a consultation →Keep reading



TRIBE Editorial · Reviewed by Silas Tan
Co-Founder, TRIBE · District Director, Huttons Asia · Ex-Mortgage Banker (AVP) · >1,000 families advised · CEA R000303I
How TRIBE scores and checks its analysis
Spotted an error, or a figure that has moved since publication? Tell us and we will correct it.
This article is for informational purposes only and does not constitute financial or investment advice.