Insights
The Step From Three Rooms to Four Looks 78% Dearer. Matched Like for Like, It Got Cheaper.
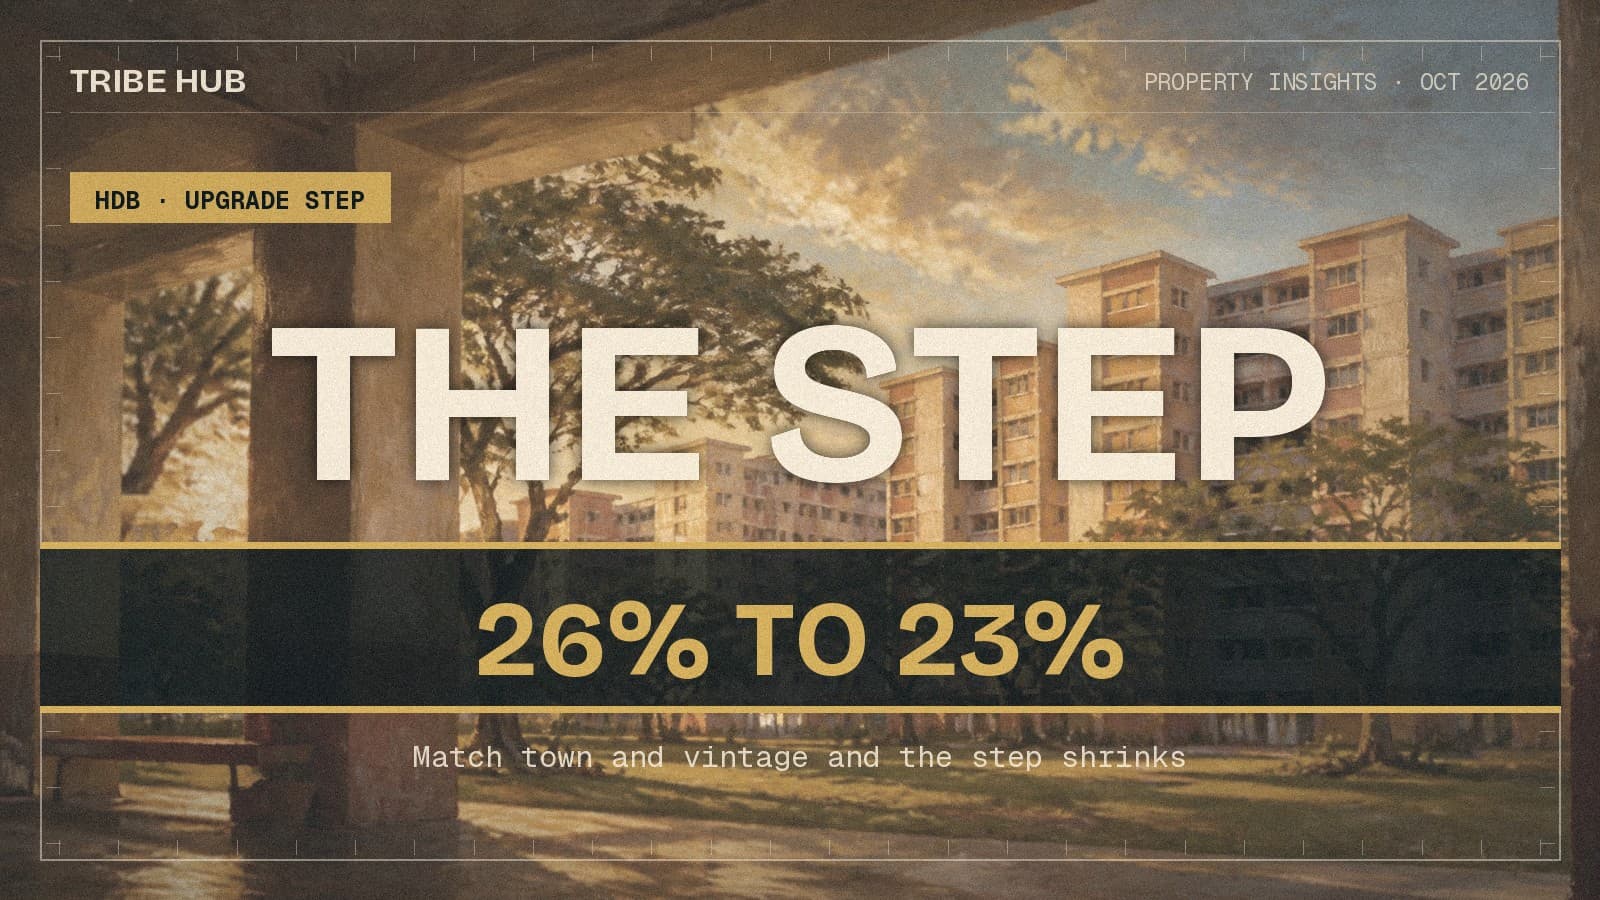
National medians say the cash gap between a three-room and a four-room flat widened 78% since 2017. Match town and vintage and the step falls from 26.1% of the four-room price to 23.1% — and it narrowed in 26 of 38 comparable cells.
By TRIBE Editorial · 4 October 2026 · 9 min read
In 2017 the median three-room resale flat in Singapore changed hands at $301,888 and the median four-room at $408,000. The step between them was $106,112. In the first nine months of 2026 those medians were $440,000 and $629,000, and the step was $189,000.
That is a 78.1% widening in nine years, against 45.7% growth in the three-room median and 54.2% in the four-room. Read straight off the national figures, moving up one room has become dramatically more expensive relative to everything else.
Hold the town constant and the lease vintage constant, and the step does the opposite. It falls from 26.1% of the four-room price to 23.1%, and it narrows in 26 of the 38 cells where we can measure it. The widening is a change in what is being sold, not in what it costs to move up a room.
What the national medians say
The naive comparison is the one every upgrader runs, and it is not wrong about the cheque.
| 2017 | 2026 Jan–Sep | Change | |
|---|---|---|---|
| Median 3-room | $301,888 (n=5,047) | $440,000 (n=4,505) | +45.7% |
| Median 4-room | $408,000 (n=8,604) | $629,000 (n=8,649) | +54.2% |
| Cash step | $106,112 | $189,000 | +78.1% |
| Step as share of the 4-room price | 26.0% | 30.0% | +4.0 pp |
Controlling for town alone barely helps. Across the 23 towns with at least 30 transactions in all four cells, the median widening is +61.6%. Toa Payoh's step went from $294,000 to $640,000, Kallang/Whampoa's from $210,000 to $455,000, Clementi's from $206,600 to $412,000. Only Central Area narrowed, by 18.6%.
So the story holds up under a geographic control, which is where most published versions of it stop.
Matching town and vintage reverses it
Add a second control — the five-year band in which the flat's lease commenced, which is the closest thing the register carries to the age and build-type of the flat — and the direction flips.
For every combination of town and five-year lease band where all four cells have enough transactions, we take the median three-room price and the median four-room price in 2017, do the same for 2026, and read the step. At a threshold of 15 transactions per cell that gives 38 cells covering 12,664 transactions, 7,529 of them in 2017 and 5,135 in 2026.
| Minimum per cell | Cells | Step share 2017 | Step share 2026 | Cells where the share fell |
|---|---|---|---|---|
| 10 | 49 | 25.7% | 22.4% | 32 of 49 |
| 15 | 38 | 26.1% | 23.1% | 26 of 38 |
| 25 | 28 | 25.9% | 23.1% | 20 of 28 |
| 40 | 16 | 25.9% | 22.4% | 14 of 16 |
The result is not sensitive to where the threshold sits. Nor is it an artefact of using a partial 2026: re-run against full-year 2025 and the share goes 26.0% to 23.3%, falling in 27 of 43 cells.
The cash gap inside those matched cells did rise — median $110,500 to $139,903, or +26.6%. But the flats on both sides of it rose faster. The matched four-room median gained 32.4% and the matched three-room median 41.1%. The step grew more slowly than either flat it sits between, which is exactly what "the step got cheaper" means in practice.
Why the headline runs the other way
The two flat types' transacting stock drifted apart. In 2017 a four-room resale was most often a 1980s or 1990s flat; by 2026 the single largest group is 2010s stock.
| Share of that flat type's resale volume | 3-room 2017 | 3-room 2026 | 4-room 2017 | 4-room 2026 |
|---|---|---|---|---|
| Pre-1990 leases | 91.3% | 71.4% | 36.7% | 27.9% |
| 1990s | 0.7% | 0.9% | 23.4% | 17.9% |
| 2000s | 1.0% | 0.7% | 20.8% | 12.9% |
| 2010s and later | 7.1% | 27.0% | 19.1% | 41.3% |
Four-room resale volume went from a fifth newly-minted stock to two-fifths. The three-room pool got newer too, but from a far older base, and it is still 71.4% pre-1990 against the four-room's 27.9%.
The lease numbers say the same thing more bluntly. Median remaining lease on a transacting three-room fell from 63.0 years to 57.4 — a loss of 5.6 years. On a four-room it fell from 79.0 to 74.6, a loss of 4.4. The flat type at the bottom of the step aged roughly a quarter faster than the one at the top, while the top acquired a large block of near-new inventory.
So the national three-room median is being held down by old stock it cannot shed, and the national four-room median is being pulled up by stock that did not exist in the 2017 sample. The gap between those two medians widened. The price of moving up a room, in a given town and a given vintage, did not.
Where the step actually fell
Four of the 38 matched cells saw the step narrow in nominal dollars — before any adjustment for nine years of inflation.
| Town and lease band | Step 2017 | Step 2026 | Change |
|---|---|---|---|
| Ang Mo Kio, 1975–79 | $137,500 | $122,500 | −10.9% |
| Jurong East, 1980–84 | $116,888 | $112,056 | −4.1% |
| Ang Mo Kio, 1980–84 | $127,000 | $122,500 | −3.5% |
| Bukit Batok, 1985–89 | $110,000 | $108,000 | −1.8% |
And the step did widen sharply in some places, mostly where the four-room stock is newer or the three-room base was unusually low: Woodlands 1990–94 went from $30,000 to $79,112, Toa Payoh 1980–84 from $125,000 to $233,444, Punggol 2010–14 from $97,000 to $159,000. The finding is a median across cells, not a claim about every estate.
The money
Financing the step at the HDB concessionary rate of 2.6% over 25 years, which is the arrangement most of these households are actually in:
| Step | Monthly cost of the step | |
|---|---|---|
| National medians, 2017 | $106,112 | $481.40 |
| National medians, 2026 | $189,000 | $857.44 |
| Matched town and vintage, 2017 | $110,500 | $501.30 |
| Matched town and vintage, 2026 | $139,903 | $634.70 |
On the national reading, the extra room costs $376 a month more than it did in 2017. On the matched reading it costs $133 a month more. The household that compares its own town and its own vintage is looking at about a third of the increase the headline implies.
What to do with this
If you are moving from a three-room to a four-room, run the comparison inside your own town and your own flat vintage, not against national medians. The national step is inflated by the fact that the four-room flats transacting today are much newer than the three-room flats transacting today — which is a statement about the market's inventory, not about your move.
If you are considering a newer four-room instead, then the national number is closer to right for you, because you are in fact buying the composition shift. Two-fifths of four-room resale volume is now 2010s-or-later stock, and that is where the price growth concentrated.
If you are selling a pre-1990 three-room, note that your flat type's transacting pool lost 5.6 years of median remaining lease in nine years, faster than any other. That is the pressure on your price, and it is separate from the question of what the next flat up costs. We have looked at what a 99-year lease is worth at 60 on its own terms.
If you are reading that upgrading has become unaffordable, the cheque did get bigger. As a share of the flat you are buying, the step is smaller than it was in 2017 in two-thirds of comparable cases. Both things are true and they answer different questions.
Method
Every figure was computed directly from the full register of 241,920 HDB resale transactions on data.gov.sg, January 2017 to October 2026, retrieved 3 October 2026. October 2026 holds only 212 registrations at the time of retrieval and is excluded from every figure; "2026" throughout means January to September 2026, n = 19,641, and September itself is still subject to late registration. All central tendencies are medians, never means. "Vintage" is the five-year band containing the dataset's own lease_commence_date, which is the nearest proxy the register carries for a flat's age and build generation; it is not a control for block, storey, floor area or flat model, so residual quality mix remains inside each cell. The matched comparison requires all four cells — 2017 three-room, 2017 four-room, 2026 three-room, 2026 four-room — to clear the stated minimum, and the reported step share is the median of the per-cell step shares, not a step computed on pooled medians. The step is a median-to-median construct: the register cannot link a seller to a buyer, so this is not a paired observation of the same household moving. Prices are gross transacted prices; the dataset carries no buyer field and no grant or CPF data, so nothing here speaks to net cash outlay, buyer income, first-timer status or whether a household was in fact upgrading. Remaining lease is as stated at transaction. The monthly figures in the money table are standard monthly-rest amortisation of the step alone over a 300-month tenure at the HDB concessionary rate of 2.6%, being the CPF Ordinary Account rate of 2.5% plus 0.1% as published by CPF for 1 October to 31 December 2026; they are the cost of financing the difference, not of financing a flat, and they ignore the sale proceeds and CPF balances a real upgrader would bring. The robustness re-run against full-year 2025 uses the identical method with 2025 in place of 2026. This is general information about the resale register, not advice on your own purchase; confirm policy, grant eligibility and loan terms with HDB and CPF before deciding anything.
Know what you can afford
Loan, stamp duty, CPF, and monthly repayments — work out your real budget before you commit. No registration required.
Plan my purchase →Prefer a personal read on your situation? Arrange a consultation →Keep reading

3 October 2026HDB
The HDB psf Record Left Duxton After Nine Years. It Won by $1.17.
2 October 2026HDB
HDB Says the Wait-Out Removal Changed Little. On Price It Is Right. On Volume It Is Not.
30 September 2026HDB
The HDB Index Has Fallen Three Quarters Running. The Busiest Quarter in Two Years Just Closed.

TRIBE Editorial · Reviewed by Silas Tan
Co-Founder, TRIBE · District Director, Huttons Asia · Ex-Mortgage Banker (AVP) · >1,000 families advised · CEA R000303I
How TRIBE scores and checks its analysis
Spotted an error, or a figure that has moved since publication? Tell us and we will correct it.
This article is for informational purposes only and does not constitute financial or investment advice.