Insights
The HDB Index Has Fallen Three Quarters Running. The Busiest Quarter in Two Years Just Closed.
Tomorrow's flash estimate covers a quarter in which 7,304 resale flats were registered, the most since 2024, while the index sits below its year-ago level for the first time since 2019. More flats trading, slightly lower like-for-like prices.
By TRIBE Editorial · 30 September 2026 · 7 min read
HDB publishes its third-quarter flash estimate tomorrow morning. The quarter it covers was the busiest in two years and, on the evidence of the index it will update, one of the flattest on record.
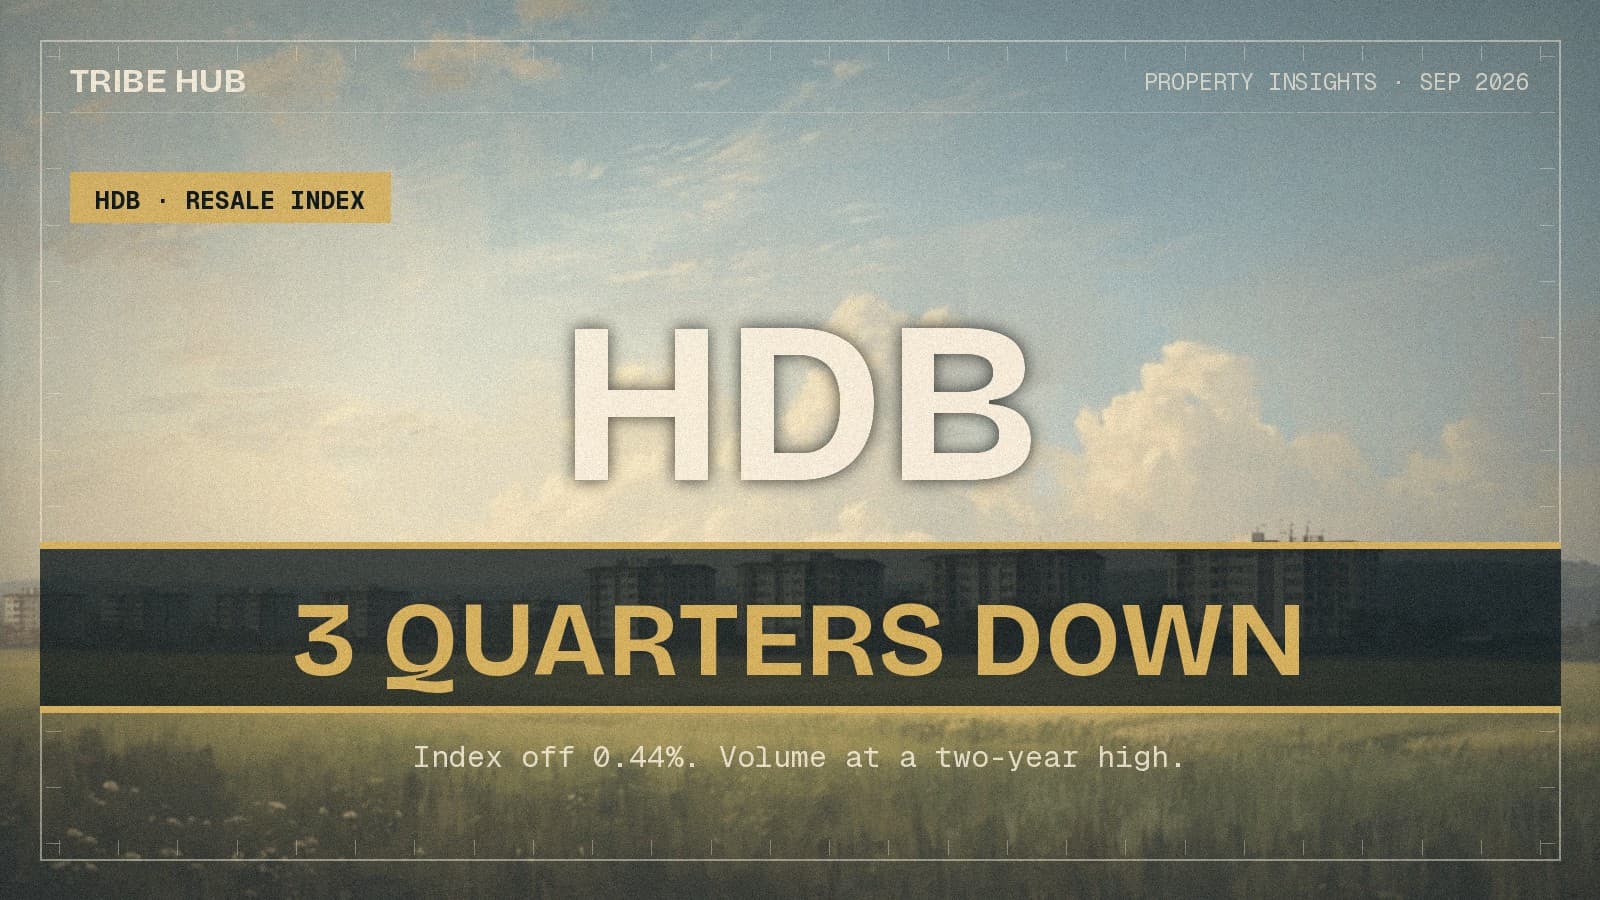
The Resale Price Index peaked at 203.7 in 3Q2025 and has fallen in every quarter since: 203.6, then 203.4, then 202.8. Three consecutive declines totalling 0.44%. In the same stretch, registered resale transactions rose from 6,042 in the first quarter to 7,304 in the third.
This is the shallowest downturn the index has recorded
Three quarters down sounds like a market turning. Measured against every other multi-quarter decline since the series began in 1990, it is barely a decline at all.
| Period | Quarters | Index move | Total change |
|---|---|---|---|
| 1997-Q1 to 1999-Q1 | 9 | 99.0 to 71.2 | -28.1% |
| 2000-Q2 to 2002-Q1 | 8 | 80.3 to 69.1 | -13.9% |
| 2013-Q3 to 2015-Q3 | 9 | 149.4 to 134.6 | -9.9% |
| 2005-Q2 to 2005-Q3 | 2 | 77.2 to 73.2 | -5.2% |
| 2016-Q4 to 2018-Q1 | 6 | 134.7 to 131.6 | -2.3% |
| 1991-Q3 to 1991-Q4 | 2 | 25.5 to 25.1 | -1.6% |
| 2018-Q3 to 2019-Q2 | 4 | 131.7 to 130.8 | -0.7% |
| 2025-Q4 to 2026-Q2 | 3 | 203.7 to 202.8 | -0.44% |
Every previous run of two or more falling quarters took more off the index than this one has. The closest analogue is the 2018-19 episode, which ran four quarters for 0.7% and then resumed climbing.
What has genuinely broken is the streak. 2Q2026 came in 0.05% below 2Q2025 — the first year-on-year decline after 26 consecutive quarters of year-on-year growth, and the first since 3Q2019. A seven-year run ended on a rounding error.
The median is moving the other way
Anyone reading transaction prices rather than the index would conclude the opposite is happening.
| Jan-Aug 2025 | Jan-Aug 2026 | |
|---|---|---|
| Registered transactions | 17,891 | 17,396 |
| Median resale price | $625,000 | $630,000 |
| Sales at $1 million or above | 1,071 (5.99%) | 1,289 (7.41%) |
The median is up 0.8% while the index is down. Quarter on quarter the divergence is wider still: the median of 3Q2026 registrations is $638,000 against $630,000 in 2Q2026, and the million-dollar share rose from 7.92% to 8.04%.
Both numbers are correct. They measure different things. The index is quality-adjusted — it holds flat type, town, age and storey roughly constant so that it tracks what the same flat would fetch. The median tracks whatever happened to sell. When the mix shifts towards larger, newer, better-located flats, the median rises even as like-for-like prices drift down.
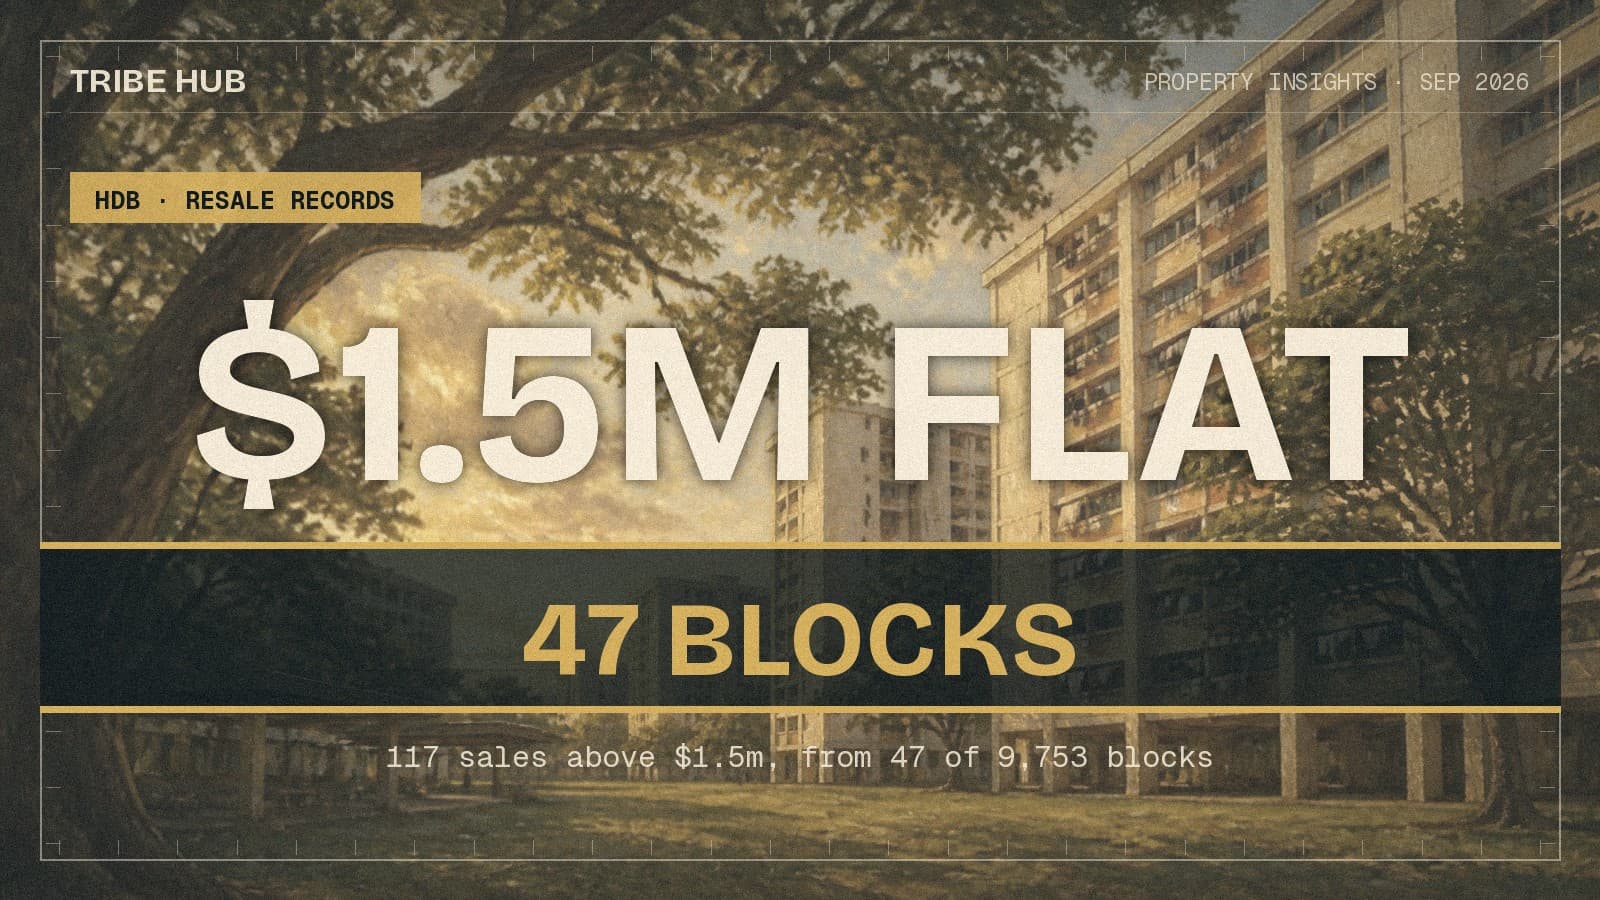
That is what the million-dollar share is telling you. Nearly one resale flat in twelve now clears seven figures, against one in seventeen a year ago and one in eighty in 2021. The top of the market is doing the work in the median. The middle, which is what the index mostly measures, is flat to slightly negative.
Volume is the part nobody expected
| Quarter | Registered transactions |
|---|---|
| 2025-Q1 | 6,303 |
| 2025-Q2 | 6,823 |
| 2025-Q3 | 6,939 |
| 2025-Q4 | 5,020 |
| 2026-Q1 | 6,042 |
| 2026-Q2 | 6,184 |
| 2026-Q3 | 7,304 |
3Q2026 is 18.1% above 2Q2026 and the fifth-heaviest quarter of the 39 since 2017, behind only 3Q2021, 3Q2024, 4Q2021 and 3Q2020. It is the heaviest since 3Q2024.
A market where prices are flat and volume is at a two-year high is not a stalling market. It is a clearing market: sellers meeting buyers at prices buyers will pay, rather than holding out and withdrawing. Flat prices plus heavy volume is what the resolution of a standoff looks like, and it is the healthier of the two ways a price run can end.
What tomorrow's number is, and is not
The flash estimate is an early read published the first working day after the quarter closes, and it gets updated when the full quarterly statistics follow later in the month. It moves, though not by much. The 1Q2026 flash came in at 203.4 and the final figure was 203.4. The 2Q2026 flash was 202.7 and the final was 202.8 — revised up a tenth of a point, with the rounded quarterly change unchanged at -0.3%.
So treat tomorrow's headline as accurate to about a tenth of a point on the level, and read the direction rather than the decimal. A fourth consecutive fall would make this the longest run of decline since 2018-19 by count, and still the mildest by magnitude. A flat or positive print would close a three-quarter dip that took less than half a percent off the index.
Neither outcome changes what a buyer should do this quarter, which is the point worth holding onto. A 0.44% move over nine months is smaller than the spread between two units in the same block. It is smaller than the fee difference between two agents. The index is telling you the market has stopped running, not that it has started falling.
What to do with this
If you are selling, the volume figure matters more to you than the index figure. Flats are transacting in numbers not seen since 2024, which means buyers are present and deals are closing — but they are closing at valuation rather than above it. Pricing to the recent same-block comparable is working; pricing to last year's peak plus optimism is what produces the listings that sit.
If you are buying, the flat index removes the urgency argument, and that is all it removes. Nothing here says wait: a market moving sideways at high volume gives you time to choose the right unit, which on the evidence of the price spread inside any single town is worth far more than a tenth of a point on a national index.
If you are watching the million-dollar headlines, discount them. The share is genuinely at a record, and it is a statement about which flats are selling, not about what your flat is worth.
Method
Index values from HDB's Resale Price Index series on data.gov.sg, 1990-Q1 to 2026-Q2, the latest published quarter. Flash estimates for 1Q2026 and 2Q2026 as published by HDB. Transaction counts, medians and million-dollar shares computed from HDB's registered resale transactions dataset on data.gov.sg, all 241,597 records from January 2017 to September 2026, retrieved 30 September 2026. Dates in that file are registration months, which trail the date a deal is agreed, and the most recent month continues to receive records after retrieval — so 3Q2026's 7,304 is a floor, not a final count. "Decline runs" are consecutive quarter-on-quarter falls in the published index. The index is quality-adjusted and the median is not; the two are not comparable measures of price change, which is the subject of this article.
Know what you can afford
Loan, stamp duty, CPF, and monthly repayments — work out your real budget before you commit. No registration required.
Plan my purchase →Prefer a personal read on your situation? Arrange a consultation →Keep reading


TRIBE Editorial · Reviewed by Silas Tan
Co-Founder, TRIBE · District Director, Huttons Asia · Ex-Mortgage Banker (AVP) · >1,000 families advised · CEA R000303I
How TRIBE scores and checks its analysis
Spotted an error, or a figure that has moved since publication? Tell us and we will correct it.
This article is for informational purposes only and does not constitute financial or investment advice.