Insights
The Best Month to Sell an HDB Flat: Volume Swings 29%, Price Doesn't Move
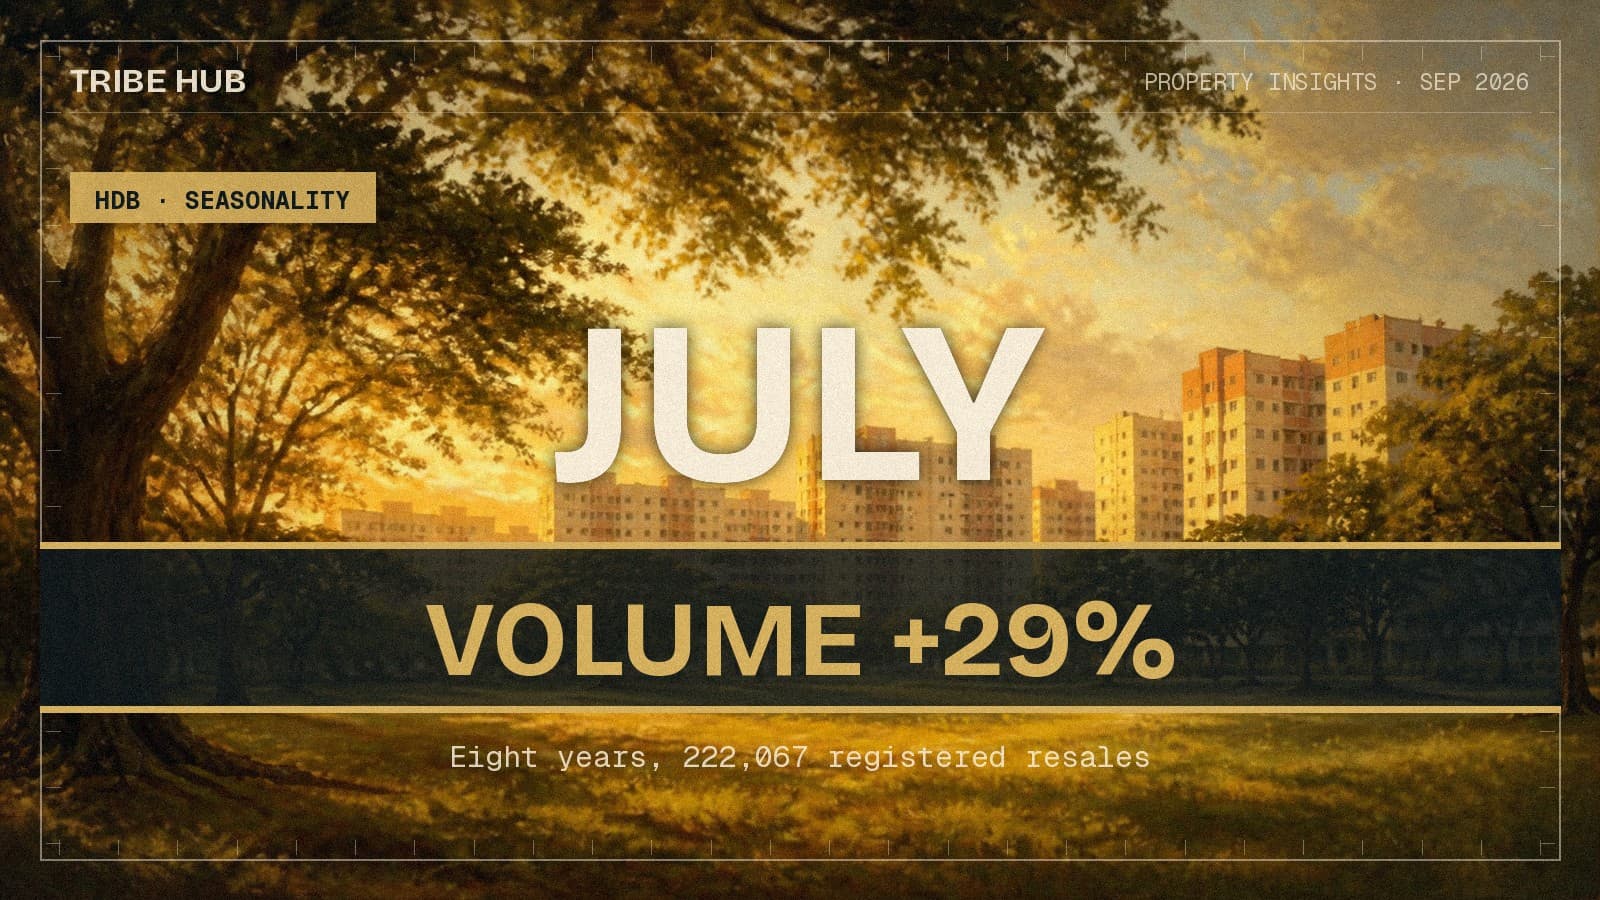
Across eight clean years and 222,067 registered resales, July runs 29% busier than February per trading day. Strip the trend out of prices and every month of the year sits within 0.3% of every other one.
By TRIBE Editorial · 26 September 2026 · 8 min read
Every seller asks some version of it. Should I list now, or wait until after Chinese New Year? Is it worth holding off until the Hungry Ghost Month is over? Does the market go quiet in December?
Two of those three have a clear answer in the data, and it is not the answer most people expect. The calendar moves the Singapore resale market a great deal — but it moves how many flats trade, not what they trade for.
What we measured
Every HDB resale transaction registered from January 2017 to September 2026 — 241,357 sales, from HDB's own file (data.gov.sg).
For the volume analysis we use the eight complete years excluding 2020, which leaves 2017–2019 and 2021–2025. Dropping 2020 is not cosmetic: April and May of that year ran at roughly a fifth of normal volume because the circuit breaker shut the transaction process down, and leaving those two months in would manufacture a spring trough that does not exist in any other year.
Each month is then indexed per calendar day, so that February is not penalised for being three days shorter than July. One hundred is that year's average trading day.
The volume year
| Month | Index (per day) | Range across 8 years | Years above 100 |
|---|---|---|---|
| July | 113.5 | 93.9 – 138.8 | 7 / 8 |
| August | 108.2 | 101.1 – 113.0 | 8 / 8 |
| April | 104.6 | 97.6 – 111.3 | 7 / 8 |
| September | 103.8 | 93.3 – 117.4 | 5 / 8 |
| May | 101.0 | 79.2 – 113.9 | 5 / 8 |
| June | 100.6 | 87.6 – 111.6 | 4 / 8 |
| November | 99.7 | 80.3 – 117.7 | 5 / 8 |
| March | 97.4 | 86.9 – 109.4 | 3 / 8 |
| October | 96.3 | 62.7 – 117.3 | 5 / 8 |
| January | 94.3 | 58.6 – 116.7 | 5 / 8 |
| December | 92.5 | 77.8 – 98.5 | 0 / 8 |
| February | 88.1 | 69.1 – 108.6 | 1 / 8 |
A July trading day carries 28.9% more transactions than a February one. By quarter, the shape is Q3 108.5, Q2 102.1, Q4 96.2, Q1 93.2.
Two months are close to laws rather than tendencies. August has finished above its year's average in all eight years, in a tight band of 101.1 to 113.0. December has finished below average in all eight, never once reaching 100. Everything in between is noisier than the averages make it look — January's range runs from 58.6 to 116.7, which is to say January tells you nothing.
The pattern holds across the market rather than sitting in one corner of it. On the unadjusted index, July against February reads 112.7 / 83.9 for three-room flats, 115.0 / 80.9 for four-room, 117.5 / 82.7 for five-room and 119.4 / 84.5 for executive flats. 2026 so far is following the script exactly: July at 121.8, August at 115.9, February at 76.4.
Registration is not the deal date
The dates in this file are registration dates, and that gap is the single most important thing to understand before reading the table above as advice.
HDB states that the resale process takes about eight weeks from its acceptance of a complete resale application to completion (HDB). Add the option period and the time both parties take to submit their halves of the application, and the deal that appears in July's registration numbers was typically agreed around late April or May.
Shift the whole table back by roughly three months and the behavioural story falls into place. The busy dealing season is spring through early summer. The dead month is December — buyers and sellers are away, and the deals not struck over the year-end holidays show up as February's registration trough, reinforced by Chinese New Year slowing the paperwork on both sides.
That is the ordinary, unmysterious version, and it is the one the data supports.
The Hungry Ghost Month does not show up
The seventh lunar month is widely held to freeze the Singapore property market. Viewings drop, the belief goes, sellers hold back, and nothing worth doing gets done until it is over.
It is not in the numbers.
The seventh lunar month falls mostly in August in eight of the last ten years, spilling into early September. August is the second-busiest registration month on the index at 108.2, and it is the only month that has never once dipped below its year's average. Even allowing for the registration lag, the deals struck during the ghost month land in October and November — which index 96.3 and 99.7, unremarkable, and inside the ordinary year-end drift rather than below it.
If a month-long buyers' strike were happening every year, a file of 241,357 transactions would show it. Some individual buyers certainly do avoid the period; enough others do not that the aggregate never moves.
Now the part that matters: price does not follow volume
Here is where the intuition breaks. A 29% swing in activity sounds like it must drag price with it. It does not.
To separate seasonality from trend, each month's median price per square metre is compared against a 13-month centred moving average of itself, again excluding 2020. The deviation left over is the calendar effect.
| Month | Mean deviation from trend |
|---|---|
| March | +0.29% |
| April | +0.26% |
| May | +0.25% |
| August | +0.15% |
| October | +0.15% |
| September | +0.08% |
| December | +0.06% |
| July | −0.00% |
| January | −0.06% |
| June | −0.07% |
| November | −0.16% |
| February | −0.28% |
Every month of the year sits between −0.28% and +0.29%. The widest gap between any two months on the calendar is 0.57 percentage points — on a median four-room flat, something in the region of $3,600, and well inside the noise of a single transaction.
Put the two findings side by side. Between the busiest and quietest months, the number of buyers in the market changes by nearly a third. The price does not change at all.
Why those two facts are compatible
They look contradictory only if you assume a thin market prices differently from a thick one. In HDB resale it does not, for a reason particular to how the transaction works.
A resale price is agreed between one buyer and one seller against a backdrop of published comparables, and HDB's valuation arrives after the price is committed, not before. Neither side is bidding against a visible queue. A February seller and a July seller are both negotiating against the same recent transaction record, and that record moves on a trend of roughly a quarter of a percent a month regardless of how many people are transacting this week.
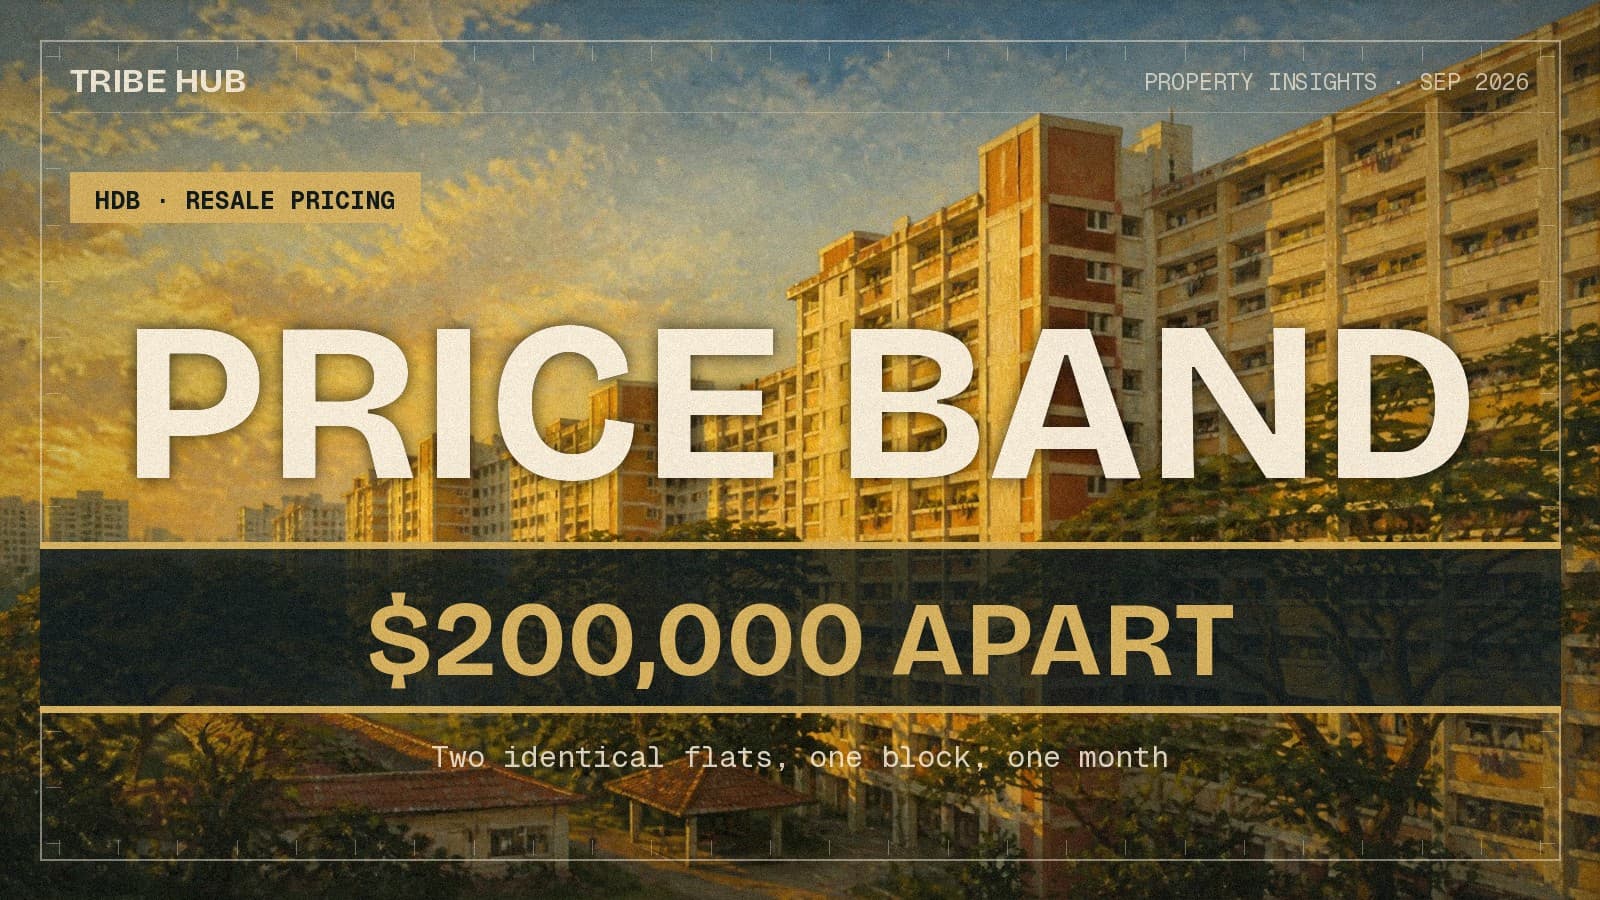
What a quiet month actually costs you is not price. It is time, and the number of draws you get. We have measured how wide the evidence in a single block already is: two genuinely identical flats in the same block, same month and same storey band sell a median 2.7% apart, and a block's own six-month price range spans 11.5% of its median. Where you land inside that band depends on how many interested buyers see your flat — and that is exactly what the calendar changes.
What to do with this
Do not wait for a better month to get a better price. There isn't one. The seasonal price effect is smaller than the difference between two honest valuations of the same flat, and far smaller than the month-to-month trend you would be sitting out. If prices are rising at a quarter of a percent a month, holding four months for a seasonal edge of a third of a percent is a losing trade.
Do think about the calendar if your flat needs buyers rather than a buyer. Anything unusual — an executive flat, a short lease, an awkward layout, a high asking price relative to the block — depends on finding the one buyer who wants precisely that. For those, listing into the spring dealing season, so completion lands in the July–August peak, genuinely puts more people in front of it. For a four-room in a well-traded block, this hardly matters.
Ignore the Hungry Ghost Month. Eight years of data say the market does not pause, and a seller who withdraws for a month is removing their own flat from a market that stayed open.
And if you are selling in order to buy, the calendar is the wrong thing to be optimising. The sequencing risk between the two transactions is worth multiples of any seasonal effect, and that one is genuinely worth planning around.
The honest summary is short. The market has a rhythm. Your price does not know about it.
Know what you can afford
Loan, stamp duty, CPF, and monthly repayments — work out your real budget before you commit. No registration required.
Plan my purchase →Prefer a personal read on your situation? Arrange a consultation →Keep reading


TRIBE Editorial · Reviewed by Silas Tan
Co-Founder, TRIBE · District Director, Huttons Asia · Ex-Mortgage Banker (AVP) · >1,000 families advised · CEA R000303I
How TRIBE scores and checks its analysis
Spotted an error, or a figure that has moved since publication? Tell us and we will correct it.
This article is for informational purposes only and does not constitute financial or investment advice.