Insights
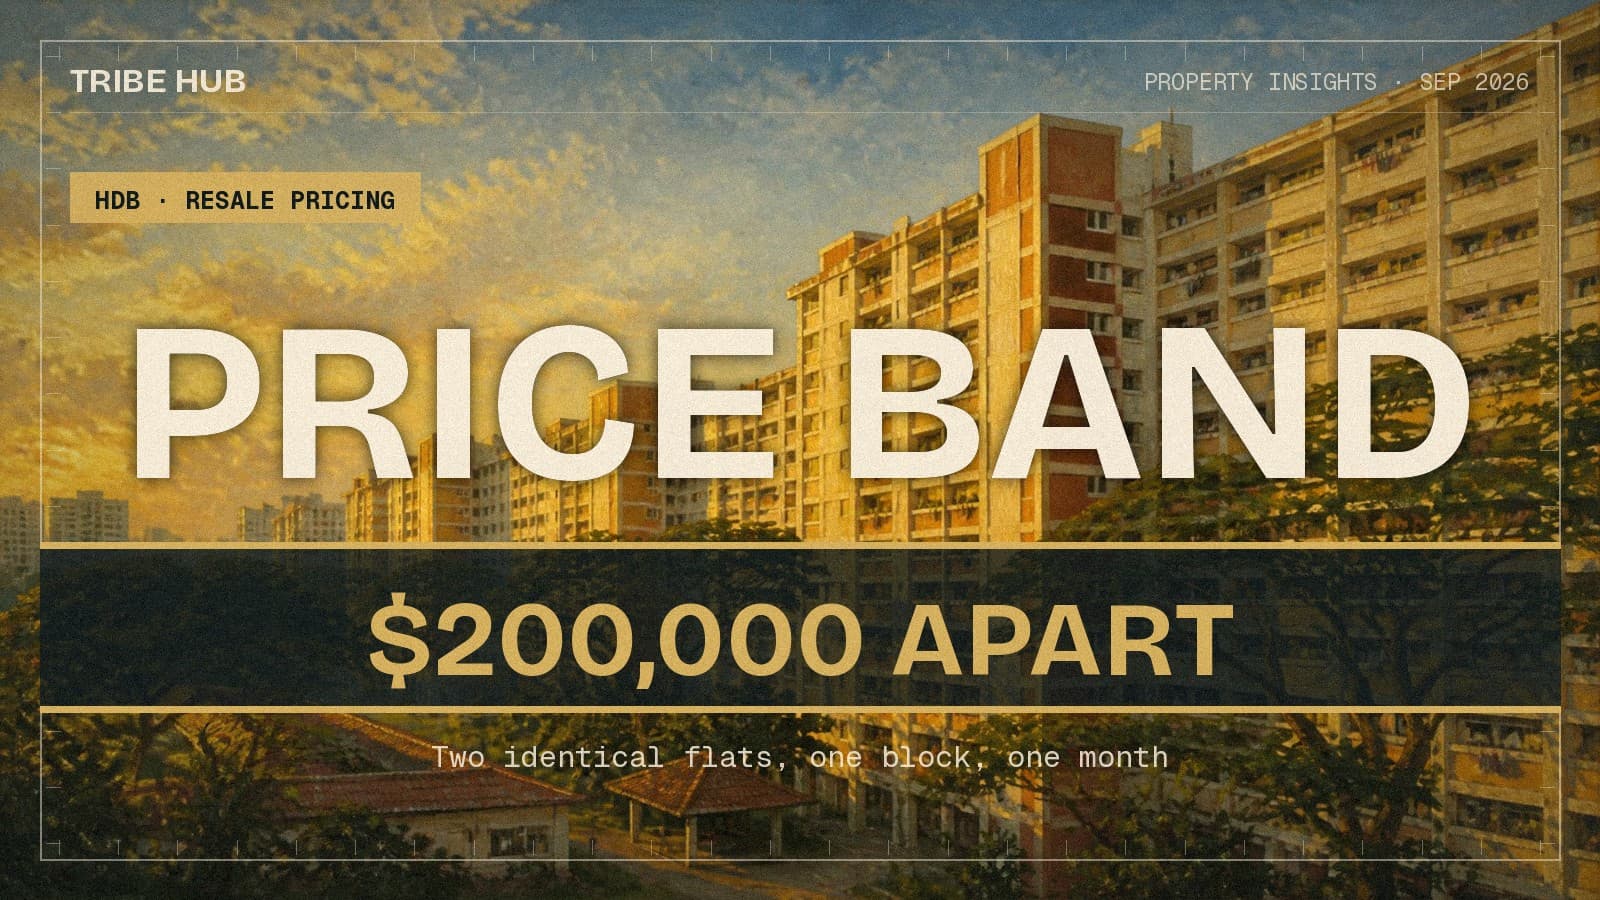
Two Identical Flats, Same Block, Same Month: $200,000 Apart
In January, two 93 sqm four-room flats at 113B McNair Road sold from the same storey band in the same month — one at $1.22 million, one at $1.02 million. Across 1,489 such pairs, the typical gap is 2.7%, which is ten months of market movement.
By TRIBE Editorial · 25 September 2026 · 9 min read
In January 2026, two four-room flats at 113B McNair Road were registered as sold. Both were 93 square metres. Both were Premium Apartments. Both had 91 years of lease remaining. Both sold from the 28th to 30th storey of the same block, in the same month.
One went for $1,220,000. The other went for $1,020,000.
There is nothing left in the transaction record to explain the $200,000. Town, block, flat type, model, floor area, remaining lease and storey band are all identical. Whatever separates those two prices is invisible to every price tool, every valuation table and every agent's comparables list — and it is not a rounding error. It is a third of a deposit.
What we measured, and how
The question "what is my flat worth" is usually answered with a number. It should be answered with a width. So we measured the width.
Every HDB resale transaction registered from January 2024 to September 2026 — 72,101 sales, from HDB's own file (data.gov.sg) — was sorted into cells of block × street × flat type × storey range × month, and within each cell we kept only pairs whose floor area differs by no more than one square metre.
That is as close to two of the same flat as a public dataset gets. Same building. Same number of rooms. Same three-storey band, so at most two floors apart. Same size. Same calendar month, so the market has not moved between them. It leaves 1,489 pairs across 1,658 qualifying cells.
Then we asked one question of each pair: how far apart did they sell?
The answer is 2.7%
| Dollar gap | As % of the pair's midpoint | |
|---|---|---|
| 25th percentile | $8,000 | 1.3% |
| Median | $15,000 | 2.68% |
| 75th percentile | $30,000 | 4.85% |
| 90th percentile | $50,000 | 7.69% |
| 99th percentile | $102,502 | 15.52% |
| Widest pair | $200,000 | 39.5% |
Only 3.8% of pairs printed the same price. Nearly a quarter — 23.8% — landed more than 5% apart, and one pair in twenty was more than 10% apart. Thirty-eight percent of pairs differed by more than $20,000; nine percent by more than $50,000.
Relax the storey condition and the gap widens as you would expect, but not by much: across all 8,550 same-block, same-type, same-month, same-size pairs regardless of floor, the median gap is $27,000, or 4.35%. Storey explains roughly a third of the spread. Two-thirds of it has no name.
2.7% is ten months of market
A 2.68% gap sounds survivable until you price it against the thing everyone watches.
Over the same 33 months, the national median resale price per square metre went from $5,875 to $6,387 — a rise of 8.7%, or about 0.26% a month. At that pace, the typical gap between two identical flats sold in the same month equals 10.3 months of market movement.
Put the other way: if you sold your flat today and your neighbour sold the same flat next door in the same month, the difference between you would, on average, be larger than everything the market did from November last year to now.
The same arithmetic explains a result that looks impossible in a rising market. Take every consecutive pair of sales in the same block, same flat type and same storey band, in different months — 27,327 of them — and ask whether the later sale printed higher.
33.9% printed lower. Another 3.7% printed exactly the same. In a market that rose 8.7%, one sale in three was a step down from the last comparable sale in its own block.
Your block's own evidence spans 11.5%
This is the number that matters if you are pricing a flat right now.
Take every block-and-flat-type combination with at least four sales since March 2026 — 633 of them — and measure the distance from the cheapest to the dearest as a share of the median. The median spread is 11.5%. At the 75th percentile it is 16.8%; at the 90th, 22.2%.
So when a seller says "flats in my block go for $700,000", the honest version is that the last half-year of evidence in that block runs from roughly $660,000 to $740,000, and every one of those prints is a real, arm's-length transaction on a flat very much like theirs. Half of all blocks are wider than that.
An asking price 3% above the last recorded sale is not an aggressive ask. It is inside the noise. So is one 3% below.
Where the spread is widest
The dispersion is not uniform, and the pattern is more about price level than about geography.
| Town | Pairs | Median gap |
|---|---|---|
| Bedok | 82 | 4.17% |
| Bukit Merah | 39 | 3.61% |
| Ang Mo Kio | 33 | 3.42% |
| Toa Payoh | 81 | 2.98% |
| Jurong West | 67 | 2.93% |
| Punggol | 93 | 2.90% |
| Yishun | 86 | 2.88% |
| Sengkang | 93 | 2.86% |
| Tampines | 160 | 2.40% |
| Bukit Batok | 146 | 2.39% |
| Sembawang | 123 | 2.23% |
| Geylang | 63 | 2.08% |
| Choa Chu Kang | 34 | 2.08% |
Bedok's twins sit twice as far apart as Choa Chu Kang's. The three widest towns are all mature estates with a deep mix of vintages and unit conditions inside a single block; the tightest are newer, more uniform, and cheaper.
By flat type, the dollar gap tracks size and the percentage gap tracks the opposite:
| Flat type | Pairs | Median gap | Median % | 90th percentile % |
|---|---|---|---|---|
| Executive | 49 | $25,000 | 2.77% | 9.97% |
| 5-room | 219 | $20,000 | 2.82% | 7.61% |
| 4-room | 775 | $15,000 | 2.35% | 6.82% |
| 3-room | 396 | $13,888 | 2.99% | 8.73% |
| 2-room | 48 | $14,000 | 3.65% | 10.65% |
Four-room flats — the most traded product in Singapore, and the one with the most comparables — are the tightest in percentage terms. That is what liquidity buys you. It still buys a 2.35% band.
And the band is widening. The median twin gap was $14,112 in 2024, $16,888 in 2025 and $19,556 in 2026 — 2.47%, 2.90% and 2.83% respectively. Prices went up; the disagreement went up faster.
What is actually inside the gap
Naming what we cannot see matters more here than in most analyses, because the entire finding is the unexplained part.
Four things sit inside these numbers and cannot be separated out with a public transaction file. Renovation — a $120,000 fit-out and an original 1990s kitchen are the same row in this dataset. Stack and facing — which way the flat looks, whether it faces the carpark or the expressway, how much afternoon sun it takes. The exact floor, since a three-storey band leaves two floors of slack. And the circumstances of the sale — a seller on a deadline, a buyer with no valuation risk, an owner who does not need the money.
Some of the spread is therefore real, priced difference rather than noise. A buyer looking at both McNair Road flats may well have seen a good reason to pay $200,000 more.
But that is precisely the point for anyone on the other side of the table. The reason is not in the data. It is not in the price tool, it is not in the caveat list, and it is not in the "recent transactions" panel your agent sends over. Those sources can tell you the centre of a distribution. They cannot tell you where in it your own flat sits.
What to do with this
Three things follow, and none of them is complicated.
Treat the last transaction as one draw, not as the market. A single comparable in your block is a sample of one from a distribution that is 11.5% wide. Two comparables are better. Six are a range.
Read a 3% disagreement as agreement. If your valuation, your agent's estimate and the neighbour's recent sale all sit within a few percent of each other, you do not have three data points converging on a truth. You have three draws from the same band. The decision that follows should not turn on which one is highest.
Expect the cash gap, and price it in. Because an HDB resale price is agreed before HDB's valuation arrives, any excess has to be paid in cash — that sequence is the design, not an accident. A 2.7% typical dispersion on a median four-room flat is roughly $17,000, which is the same order of magnitude as the cash-over-valuation figures buyers actually report paying. A good part of what looks like "paying above valuation" is simply two honest estimates landing on opposite sides of the same band.
The flat is worth a range. Everyone quoting you a number has picked a point inside it, and nobody — not HDB's valuer, not the tool, not us — can tell you which point is yours.
Computed from 72,101 HDB resale transactions registered between January 2024 and September 2026, published by HDB on data.gov.sg; September 2026 is a partial month. Pairs are matched on block, street, flat type, storey range and registration month, with floor area within one square metre. Related: what a storey is actually worth, the flat models HDB stopped building, and valuation, COV and what a flat is really worth. Methodology published. No spin.
Know what you can afford
Loan, stamp duty, CPF, and monthly repayments — work out your real budget before you commit. No registration required.
Plan my purchase →Prefer a personal read on your situation? Arrange a consultation →Keep reading

TRIBE Editorial · Reviewed by Silas Tan
Co-Founder, TRIBE · District Director, Huttons Asia · Ex-Mortgage Banker (AVP) · >1,000 families advised · CEA R000303I
How TRIBE scores and checks its analysis
Spotted an error, or a figure that has moved since publication? Tell us and we will correct it.
This article is for informational purposes only and does not constitute financial or investment advice.