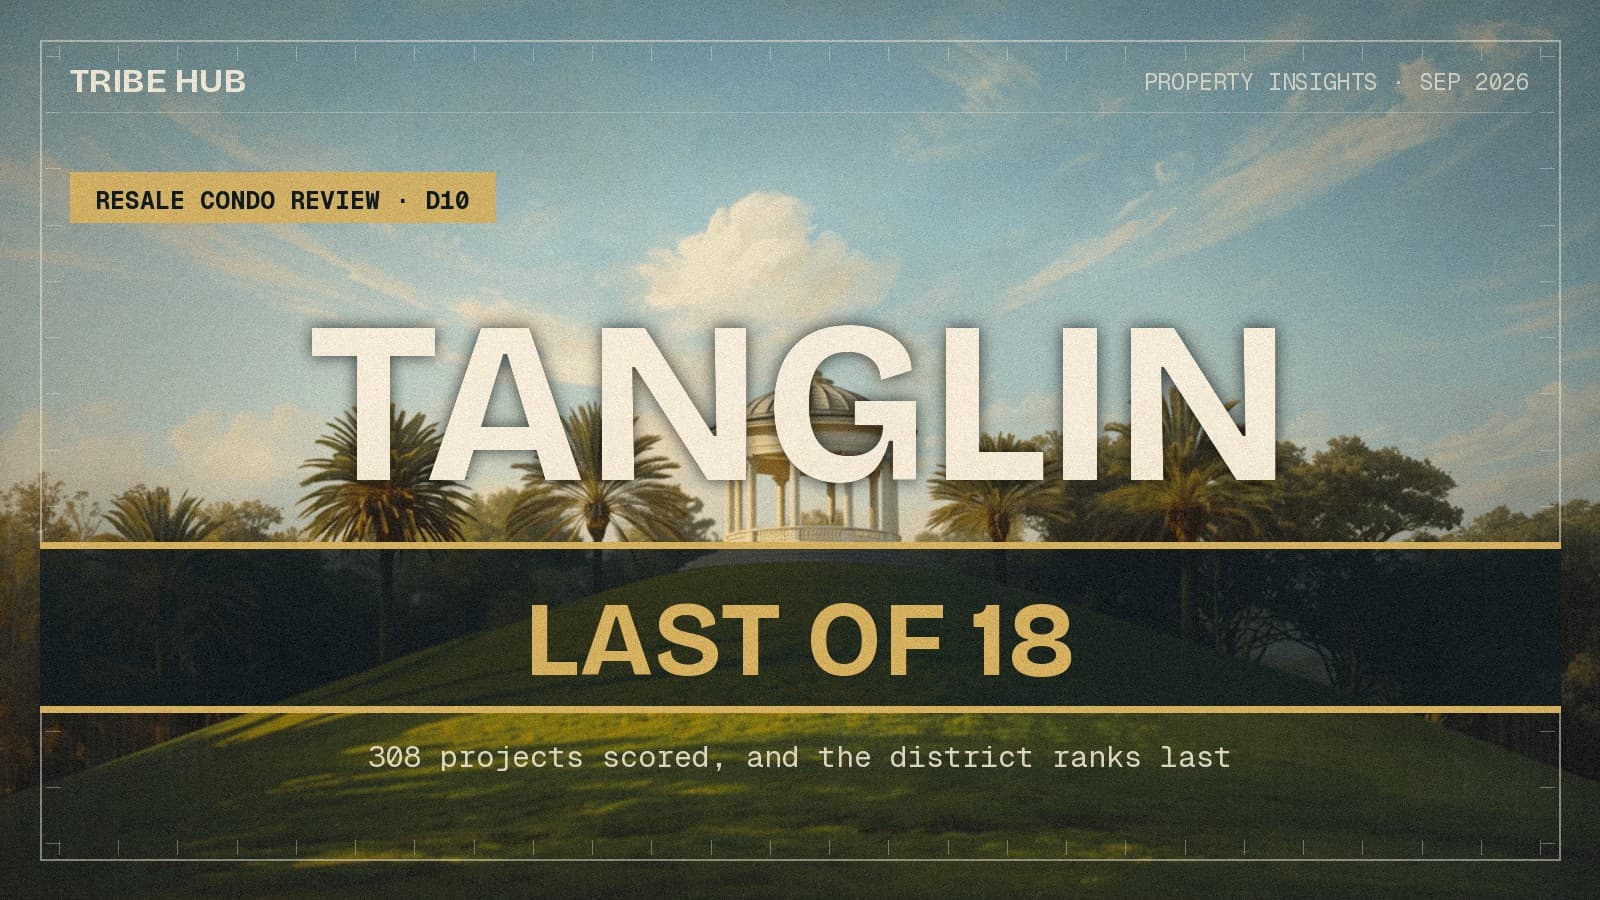
Insights
Top 5 Condos in Holland, Tanglin and Bukit Timah — the Lowest-Scoring Large District in Singapore
District 10 has more scored condos than any district except one, and the most freehold stock in Singapore. On the Resale Property Scorecard it finishes last of the eighteen districts with 30 or more projects.
By TRIBE Research · 24 September 2026 · Updated 16 October 2026 · 9 min read
District 10 — Holland Road, Tanglin, Bukit Timah, Ardmore — is the address the rest of the market is measured against. It holds 307 scored condominiums, more than any district in Singapore except D15, and 92% of them are freehold or 999-year. Run the Resale Property Scorecard across all of them and the district mean is 5.250 against a national 5.990. Among the eighteen districts with 30 or more scored projects, that is last.
Not low. Last. Below D9, below D5, below D17. The district that prices highest on a per-square-foot basis scores lowest on realised outcomes, and the reasons are specific enough to name.
What 307 projects look like
| Grade | Projects | Share |
|---|---|---|
| S | 1 | 0.3% |
| A | 13 | 4.2% |
| B | 113 | 36.8% |
| C | 115 | 37.5% |
| D | 65 | 21.2% |
One S grade in 307. Nationally, 9.4% of scored condos carry a D; in D10 it is 21.2%, the second-highest of the eighteen large districts. Only 17.9% of D10 projects score above the national average, against 48.5% of projects nationally — so a buyer picking at random here has roughly a one-in-five chance of landing above the market's midpoint, where elsewhere it is a coin flip.
The ceiling is the sharper number. The best-scoring project in D10 is 7.43. In D13, with 44 projects, the top is 8.98; in D19, 9.21; in D23, 9.35. With seven times D13's stock, D10 cannot produce a single project that scores as well as D13's best. Of the eighteen large districts, only D17 has a lower ceiling.
Where the 0.740 points go
Against the national average, each factor's contribution is its weight times its gap:
| Factor | Weight | D10 | National | Contribution |
|---|---|---|---|---|
| Schools | 20% | 5.04 | 6.40 | −0.272 |
| Historical performance | 25% | 4.57 | 5.57 | −0.250 |
| Rental yield | 10% | 2.54 | 4.25 | −0.171 |
| Project size | 16% | 3.78 | 4.63 | −0.136 |
| Tenure | 10% | 9.75 | 9.31 | +0.044 |
| MRT | 13% | 8.15 | 7.91 | +0.031 |
| Future transformation | 6% | 3.41 | 3.18 | +0.014 |
The contributions sum to −0.740 against an actual gap of −0.740. D10 loses four of seven factors and wins three, and the three it wins are the three lightest things on its card.
The worst rental yield in Singapore
D10's rental-yield score of 2.54 is not merely below average. It is the lowest of any district with 30 or more scored projects — below D9, below D11, below every suburban district by a wide margin, against a national 4.25 and a best of 6.62 in D27.
The underlying yields say it plainly. Across the 299 D10 projects with a yield in the scorecard, the median gross yield is 2.46% against a national median of 3.08%, and 82% of them yield under 3% where the national figure is 45%. Three of the five top-scoring projects in the district yield between 2.24% and 2.86%.
This is what a price ceiling looks like from the income side. Rents in D10 are high in absolute terms and are not the problem; the denominator is. When capital values run ahead of what tenants will pay, the yield compresses, and the scorecard — which weights income at 10% — reads that as a real and permanent characteristic of the district rather than a temporary mispricing.
The schools result is the surprising one
D10 contains Nanyang Primary, Henry Park, Anglo-Chinese School (Primary) and Singapore Chinese Girls'. It scores 5.04 on schools, 17th of the 18 large districts, against a national 6.40.
The explanation is not that the schools are weak. It is that they are few, and the district is large and low-density. The scorecard measures primary schools within one kilometre of the project, and in a district of 307 developments spread across Bukit Timah's long road corridors, most projects reach one school or none. Four of the district's five best projects score exactly 7 on schools — the mark for a single well-subscribed primary within 1km. A suburban district with four ordinary primaries inside the same radius scores higher, and on this measure it should: the buyer's optionality is genuinely greater.
Freehold is worth 0.044
D10 is 267 freehold projects, 17 at 999 years, 21 at 99 years. It scores 9.75 on tenure, fifth-highest in the country, and that near-maximum score contributes +0.044 points to a district that is 0.740 below the national average.
Nor does freehold separate the winners from the losers inside the district. Freehold and 999-year projects average 5.264; the 23 leasehold ones average 5.071 — a gap of under two-tenths of a point, well inside the noise of a 23-project sample. And 88% of the 65 D-graded projects here are freehold. Whatever is going wrong in the bottom fifth of this district, tenure is not protecting against it.
The D-graded group is a clear portrait: median 43 units, mean schools score 1.80, mean yield score 2.15, mean historical performance 3.31 — small freehold blocks with no school catchment, thin income and a weak transaction record. There are 65 of them, and they are 21% of the district.
The five highest-scoring projects
1. Leedon Residence — 7.43, grade S. 381 units, freehold, 2015, UOL Group. The only S grade in the district. Scores 9 on historical performance — +2.64% average annual, 84th percentile of its 2015 cohort — 8 on MRT at 560 m from Holland Village MRT (CC21), and 8 on size. Schools is a 7: one primary within 1km, Nanyang Primary at 0.94km. Its weak factor is the district's own: a 2.86% rental yield, scoring 3.
2. The Marbella — 7.31, grade A. 239 units, freehold, 2005. The best capital appreciation of the five: +4.49% average annual, 78th percentile of its 2005 cohort. Scores 9 on MRT at 290 m from Dover MRT (EW22) and 8 on size. Henry Park Primary at 0.65km gives it a 7 on schools. Rental yield is 2.44%, scoring 2 — the weakest income return in the top five.
3. One Robin — 7.14, grade A. 14 units, freehold, 2009, Far East Organization. Scores 9 on historical performance and 9 on MRT at 300 m from Stevens MRT (DT10 / TE11), and it is the only project in the top five with a genuinely decent yield at 3.64%. It lands third because of its size: 14 units scores 3, and the scorecard flags it explicitly as a niche product with a thin resale market. Two primaries within 1km, Singapore Chinese Girls' at 0.20km.
4. Nouvel 18 — 7.05, grade A. 156 units, freehold, 2014, City Developments. The strongest appreciation record in the district's top tier — +3.30% average annual, top 10% of its 2014 cohort, scoring 10. It pays for it on income and, to a lesser degree, access: a 2.24% yield scoring 2, and 770 m to Orchard MRT (NS22 / TE14) scoring 7, the weakest MRT mark in the five.
5. One Holland Village — 6.90, grade A. 559 units, 99-year, 2025, City Developments. The best-connected of the five: a full 10 on MRT at 180 m from Holland Village MRT (CC21), and 10 on size. Its record is short but strong so far — +1.75% average annual, 77th percentile of its 2025 cohort — and its yield of 3.33% scores 5. Its weakness is schools: the nearest primary, Henry Park, is 1.11km away, just outside the 1km mark, scoring 2. It is also the only leasehold project in the five, with about 91 years remaining. RV Residences (6.89) sits a hundredth of a point behind it.
Two patterns run through the five. Every one of them scores 3 to 4 on future transformation — the nearest catalysts are Bukit Timah Turf City at 2.43km, the Newton–Orchard precinct at 1.11 to 1.23km, and Greater One-North at 1.97 to 2.58km, all far enough that the scorecard rates the effect as modest. And three of the five score 3 or lower on rental yield.
What this district is, honestly
Two things are true at once and the market usually only says the first.
D10 is where a large share of Singapore's best-located, best-built, freehold housing stock sits, and the top of it is genuinely strong: Leedon Residence and The Marbella both beat three-quarters of their vintage cohorts on capital appreciation. Nothing in the data argues against owning a good project here.
What the data does not support is the district as a category. Fifty-nine percent of the 307 scored projects here carry a C or a D. The median project is 50 units. The median gross yield is 2.46%. On the scorecard's heaviest factor, historical performance, the district sits a full point below the national average. Prestige is a statement about the address; the scorecard is a statement about what the 307 projects standing on it have actually done.
If you are buying in D10, the project selection matters more than it does anywhere else in Singapore, because the dispersion is wider and the base rate is worse. Read the unit count and the appreciation record before you read the postcode, and treat freehold as what the numbers say it is here — a real feature worth 0.044 points, and not a thesis.
Scores, grades and the quoted rationale text are from the TRIBE Resale Property Scorecard as published at tribesg.com/rps, covering 2,350 resale condominiums; scores and grades as at 16 October 2026. District means, factor decompositions and yield distributions are computed across all 307 scored D10 projects. RPS measures realised outcomes and current attributes, not causes, and is not a price forecast or a recommendation to buy or sell any specific project. Methodology published. No spin.
Condos in this article



Check how your condo scores
2,350 condos independently scored across 7 weighted factors. No registration required.
Score my resale →Prefer a personal read on your situation? Arrange a consultation →Keep reading
25 September 2026Resale Projects Reviews
Top 5 Condos in Changi and Loyang: One Factor Explains the Whole District

23 September 2026Resale Projects Reviews
Top 5 Condos in Little India and Farrer Park — the Only Large District With No Failing Grade
22 September 2026Resale Projects Reviews
Top 5 Resale Condos in Potong Pasir and Macpherson. District 13 Is Fifth of 28 — and Every Project Fails the Same Factor.
Next step
TRIBE Research
Written with AI assistance from TRIBE's own data and the public sources listed, then checked against them. General information, not financial advice. How we write
How TRIBE scores and checks its analysis
Spotted an error, or a figure that has moved since publication? Tell us and we will correct it.
General information only, not financial, investment, legal or tax advice. It does not consider your own circumstances; check your own numbers before you commit.