Resale Project Scorecard
Caribbean @ Keppel Bay
D04 · HarbourFront, Telok Blangah · 99-year leasehold · completed 2004 · 969 units
Grade D, 4.48 out of 10, the 14th highest score among 24 resale condos in District 4.
- Lease left, about
- 72 yrs
- Resales, 12 months to Oct 2026
- 30
- To Telok Blangah MRT
- 660m
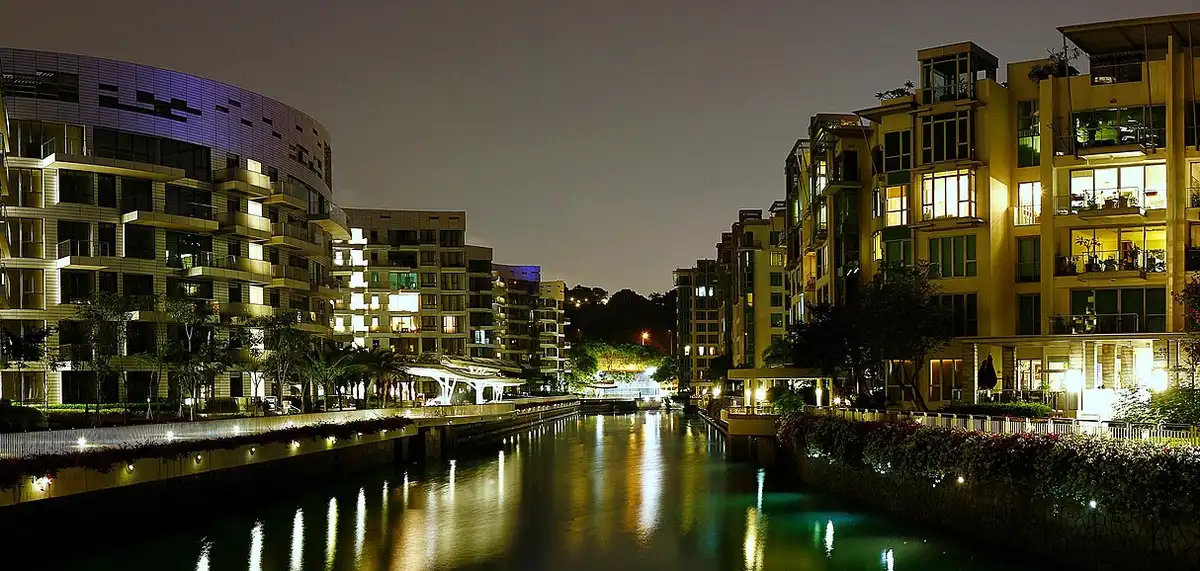
Photo: Erwin Soo, CC BY 2.0 (Wikimedia Commons)
Caribbean @ Keppel Bay Score
- D
- Grade
- Score out of 10
- 4.48
- Highest score among 24 resale condos in District 4
- 14th
Weak project — significant gaps in multiple factors. Standout strengths: project size. Key weaknesses: schools, capital appreciation.
Project's Historical Performance25%1/10
Avg Ann. of +2.03% — bottom 7% within its 2004-era cohort. Weak capital appreciation, even when judged against vintage peers.
The district median is 2/10.
Primary School Effect20%2/10
No primary schools within 1km — school access is limited, particularly for parents prioritising Primary 1 registration.
The district median is 2/10.
Straight-line estimate from the nearest block, not MOE's official 1km catchment. Check a specific unit's postal code on OneMap School Query →
Project Size16%8/10
969 units — good project size supporting active resale market and adequate facilities.
The district median is 5/10.
MRT Proximity13%7/10
0.66km from Telok Blangah MRT (CC28) — short walk to MRT, good transport convenience.
The district median is 5.5/10.
Rental Yield10%6/10
Rental yield of 3.64% — above-average income return.
The district median is 4/10.
Tenure10%7/10
99YR tenure — about 72 years remaining; some long-term decay exposure but not imminent.
The district median is 8/10.
Future Transformation6%6/10
Moderate future-catalyst exposure — nearest meaningful driver: Greater Southern Waterfront – Telok Blangah precinct at 0.92km. Some forward-looking tailwind, but the impact is more diffuse than for adjacent-zone projects.
The district median is 5/10.
Scores updated October 2026. On the map →
Why Caribbean @ Keppel Bay scores 4.48
Caribbean @ Keppel Bay scores 4.48 out of 10 on the TRIBE Resale Project Scorecard, Grade D, ranking 2172nd of 2,351 resale condos scored in Singapore and 14th of 24 in District 4 (HarbourFront, Telok Blangah). Its strongest factors are Project Size (8/10) and MRT Proximity (7/10); its weakest is Project's Historical Performance (1/10).
| Factor | This condoCaribbean @ Keppel Bay | DistrictDistrict median | EffectEffect on score | Scores above |
|---|---|---|---|---|
| Project's Historical Performance25% | 1/10 | 2/10 | −0.25 | 0% of district |
| Primary School Effect20% | 2/10 | 2/10 | ±0.00 | 43% of district |
| Project Size16% | 8/10 | 5/10 | +0.48 | 57% of district |
| MRT Proximity13% | 7/10 | 5.5/10 | +0.20 | 52% of district |
| Rental Yield10% | 6/10 | 4/10 | +0.20 | 87% of district |
| Tenure10% | 7/10 | 8/10 | −0.10 | 4% of district |
| Future Transformation6% | 6/10 | 5/10 | +0.06 | 78% of district |
Medians are across the 24 scored resale projects in District 4 (HarbourFront, Telok Blangah). “Effect on score” is the factor's weighted difference from that median, so the column sums (to within rounding) to the gap between Caribbean @ Keppel Bay and a median-profile project (3.92). “Scores above” is the share of those projects this one out-scores on the factor. Weights and bands are on the methodology page.
Caribbean @ Keppel Bay Prices
By unit type at Caribbean @ Keppel Bay
| Unit type | Size | Sold for | Median PSF | Sales |
|---|---|---|---|---|
| 2-bedroom893 sq ft | 893 sq ft | $1.70M to $1.96M | $1,959 psf | 7 |
| 3-bedroom1,281 sq ft | 1,281 sq ft | $2.30M to $3.48M | $1,949 psf | 19 |
| 4-bedroom2,433 sq ft | 2,433 sq ft | $3.55M to $5.01M | $2,059 psf | 3 |
Past transactions at Caribbean @ Keppel Bay
30 resales, Nov 2025 to Oct 2026 · median $1,954 psf · $1,700,000 to $5,008,888 · 29 of 30 sold at a profit
| Sale | ||||||||
|---|---|---|---|---|---|---|---|---|
| 16 Sep 2026 | 42 Keppel Bay Drive | 4 | #04-1111113BR · Blk 42 | 3BR | 1,335 | $1,993 | $2,660,000 | Resale |
| 28 Aug 2026 | 34 Keppel Bay Drive | 6 | #06-66664BR · Blk 34 | 4BR | 3,208 | $1,185 | $3,800,000 | Resale |
| 19 Aug 2026 | 24 Keppel Bay Drive | 3 | #03-33332BR · Blk 24 | 2BR | 893 | $1,959 | $1,750,000 | Resale |
| 17 Aug 2026 | 42 Keppel Bay Drive | 2 | #02-1031033BR · Blk 42 | 3BR | 1,335 | $1,761 | $2,350,000 | Resale |
| 29 Jun 2026 | 34 Keppel Bay Drive | 4 | #04-67674BR · Blk 34 | 4BR | 1,636 | $2,170 | $3,550,000 | Resale |
| 10 Jun 2026 | 4 Keppel Bay Drive | 7 | #07-02023BR · Blk 4 | 3BR | 1,281 | $1,913 | $2,450,000 | Resale |
| 9 Jun 2026 | 40 Keppel Bay Drive | 3 | #03-96963BR · Blk 40 | 3BR | 1,270 | $2,047 | $2,600,000 | Resale |
| 29 May 2026 | 34 Keppel Bay Drive | 3 | #03-71713BR · Blk 34 | 3BR | 1,227 | $1,972 | $2,420,000 | Resale |
| 22 May 2026 | 30 Keppel Bay Drive | 3 | #03-52522BR · Blk 30 | 2BR | 893 | $1,936 | $1,730,000 | Resale |
| 13 May 2026 | 22 Keppel Bay Drive | 3 | #03-32323BR · Blk 22 | 3BR | 1,324 | $2,077 | $2,750,000 | Resale |
Show as a table
| Period | Sales | Median PSF | D4 |
|---|---|---|---|
| Nov 2025 | 1 | — | $1,818 psf |
| Dec 2025 | 3 | $1,938 psf | $1,746 psf |
| Jan 2026 | 6 | $1,963 psf | $1,974 psf |
| Feb 2026 | 3 | $1,974 psf | $1,784 psf |
| Mar 2026 | 5 | $1,918 psf | $1,832 psf |
| Apr 2026 | 1 | — | $1,856 psf |
| May 2026 | 4 | $1,954 psf | $1,865 psf |
| Jun 2026 | 3 | $2,047 psf | $1,777 psf |
| Jul 2026 | — | — | $1,770 psf |
| Aug 2026 | 3 | $1,761 psf | $1,800 psf |
| Sep 2026 | 1 | — | $1,786 psf |
| Oct 2026 | — | — | — |
A month is plotted from two sales up; the district line from ten.
Sellers here made a median +2.7% a year, ranked 6 of 20 in D04 and 931 of 1,533 condos. See the most profitable condos in D04 →
URA REALIS resale and sub-sale caveats, Nov 2021 to Oct 2026. Check one unit →
Caribbean @ Keppel Bay Rent
- Median rent a month
- $5,250 to $11,750
- Gross yield
- 3.6% to 3.7%
- Rental contracts
- 272
| Unit type | Median rent | Most rents | Gross yield | LetsContracts |
|---|---|---|---|---|
| 2-bedroom | $5,250 | $5,100 to $5,500 | 3.6% | 97 |
| 3-bedroom | $7,500 | $7,200 to $8,200 | 3.7% | 145 |
| 4-bedroom | $11,750 | $10,080 to $13,380 | 3.7% | 30 |
Rental contracts at Caribbean @ Keppel Bay
272 contracts, Sep 2025 to Aug 2026 · median $7,200 a month · $4,600 to $24,000
| Month | Type | Size | Rent a month |
|---|---|---|---|
| Aug 2026 | 2BR | 800 to 900 sq ft | $4,800 |
| Aug 2026 | 2BR | 800 to 900 sq ft | $4,900 |
| Aug 2026 | 2BR | 800 to 900 sq ft | $5,000 |
| Aug 2026 | 2BR | 1,100 to 1,200 sq ft | $5,100 |
| Aug 2026 | 2BR | 800 to 900 sq ft | $5,200 |
| Aug 2026 | 2BR | 800 to 900 sq ft | $5,300 |
| Aug 2026 | 2BR | 1,200 to 1,300 sq ft | $5,400 |
| Aug 2026 | 2BR | 900 to 1,000 sq ft | $5,500 |
| Aug 2026 | 2BR | 900 to 1,000 sq ft | $5,600 |
| Aug 2026 | 3BR | 1,300 to 1,400 sq ft | $7,000 |
URA rental contracts. The table above is the 12 months to August 2026. Yield is gross. URA publishes no unit number for a letting.
Caribbean @ Keppel Bay By stack
- Highest, stack 118
- $2,126 psf
- Lowest, stack 50
- $1,517 psf
- Stacks with 2+ resales
- 51
| Stack | Median PSF | Size | Sold on | Sales |
|---|---|---|---|---|
| 01 | $1,868 psf | 1,647 sq ft | Levels 5 to 6 | 2 |
| 03 | $1,804 psf | 1,281 sq ft | Levels 2 to 5 | 2 |
| 05 | $1,764 psf | 1,281 sq ft | Levels 2 to 7 | 2 |
| 06 | $1,870 psf | 1,281 sq ft | Levels 4 to 9 | 3 |
| 10 | $1,849 psf | 1,329 sq ft | Levels 1 to 4 | 2 |
| 11 | $1,783 psf | 1,281 sq ft | Levels 3 to 10 | 4 |
| 13 | $1,805 psf | 1,313 sq ft | Levels 1 to 10 | 3 |
| 15 | $1,761 psf | 1,647 sq ft | Levels 1 to 6 | 3 |
Show the other 43 stacks
| Stack | Median PSF | Size | Sold on | Sales |
|---|---|---|---|---|
| 18 | $1,831 psf | 1,668 sq ft | Levels 2 to 8 | 2 |
| 19 | $1,935 psf | 899 sq ft | Levels 3 to 9 | 2 |
| 24 | $1,790 psf | 883 sq ft | Levels 1 to 4 | 3 |
| 27 | $1,613 psf | 1,970 sq ft | Levels 6 to 8 | 2 |
| 28 | $1,560 psf | 1,959 sq ft | Levels 5 to 8 | 2 |
| 29 | $1,856 psf | 872 sq ft | Levels 1 to 5 | 3 |
| 32 | $1,898 psf | 1,518 sq ft | Levels 1 to 7 | 3 |
| 33 | $1,954 psf | 893 sq ft | Levels 3 to 5 | 2 |
| 41 | $1,773 psf | 893 sq ft | Levels 3 to 4 | 2 |
| 43 | $1,583 psf | 1,970 sq ft | Levels 8 to 9 | 2 |
| 47 | $1,939 psf | 840 sq ft | Levels 1 to 7 | 3 |
| 48 | $1,875 psf | 1,216 sq ft | Levels 2 to 7 | 4 |
| 49 | $1,983 psf | 1,206 sq ft | Levels 4 to 7 | 2 |
| 50 | $1,517 psf | 1,970 sq ft | Levels 7 to 9 | 2 |
| 51 | $1,921 psf | 1,346 sq ft | Levels 6 to 7 | 2 |
| 52 | $1,936 psf | 893 sq ft | Levels 2 to 9 | 4 |
| 54 | $1,834 psf | 1,410 sq ft | Levels 1 to 7 | 2 |
| 61 | $2,001 psf | 1,227 sq ft | Levels 3 to 8 | 2 |
| 62 | $1,936 psf | 1,346 sq ft | Levels 2 to 6 | 2 |
| 66 | $1,904 psf | 1,733 sq ft | Levels 1 to 6 | 3 |
| 71 | $1,915 psf | 1,227 sq ft | Levels 2 to 3 | 2 |
| 73 | $1,856 psf | 1,238 sq ft | Levels 2 to 6 | 2 |
| 76 | $1,844 psf | 899 sq ft | Levels 4 to 6 | 2 |
| 77 | $1,612 psf | 2,809 sq ft | Levels 3 to 5 | 2 |
| 89 | $1,776 psf | 1,082 sq ft | Levels 1 to 5 | 2 |
| 93 | $1,826 psf | 1,227 sq ft | Levels 4 to 5 | 2 |
| 94 | $1,865 psf | 1,281 sq ft | Levels 1 to 2 | 2 |
| 97 | $1,815 psf | 1,254 sq ft | Levels 4 to 6 | 2 |
| 100 | $1,936 psf | 899 sq ft | Levels 3 to 6 | 2 |
| 101 | $1,875 psf | 893 sq ft | Levels 6 to 7 | 2 |
| 103 | $1,821 psf | 1,346 sq ft | Levels 2 to 7 | 2 |
| 104 | $1,883 psf | 1,206 sq ft | Levels 4 to 5 | 2 |
| 105 | $1,863 psf | 1,227 sq ft | Levels 6 to 7 | 2 |
| 111 | $1,922 psf | 1,346 sq ft | Levels 4 to 6 | 2 |
| 112 | $1,869 psf | 893 sq ft | Levels 3 to 7 | 3 |
| 113 | $1,773 psf | 1,082 sq ft | Levels 1 to 8 | 2 |
| 114 | $1,722 psf | 1,410 sq ft | Levels 1 to 4 | 2 |
| 116 | $1,874 psf | 1,227 sq ft | Levels 2 to 6 | 3 |
| 118 | $2,126 psf | 840 sq ft | Levels 2 to 9 | 2 |
| 122 | $1,981 psf | 1,346 sq ft | Levels 3 to 8 | 2 |
| 125 | $1,841 psf | 893 sq ft | Levels 4 to 10 | 3 |
| 126 | $1,937 psf | 1,335 sq ft | Levels 2 to 6 | 2 |
| 129 | $1,913 psf | 1,281 sq ft | Levels 4 to 10 | 3 |
URA REALIS resale caveats, 2022 to Oct 2026. Sun path by facing →
Caribbean @ Keppel Bay Notes
How these numbers are worked out
- Grade D rates the project, not a unit. Two Caribbean @ Keppel Bay units can be very different buys: the asking price, stack, floor, facing and condition decide the outcome.
- PSF against the district: $1,954 psf at Caribbean @ Keppel Bay against $1,820 psf across District 4, medians over 12 months.
- MRT distance is a straight line on the map; the walking route is longer.
- Prices: aggregates of URA REALIS resale caveats, data to October 2026 (Nov 2025 – Oct 2026; the year before is Nov 2024 – Oct 2025, median $1,913 psf). A specific unit's value depends on floor, size, facing and condition.
- By unit type: a price range is shown from three sales up; with two, the figure is the median. Unit types with one sale, and sales with no bedroom count on record, are left out.
- Past transactions: every resale and sub-sale caveat lodged with URA from Nov 2021 to Oct 2026, newest first; a unit is its storey and stack (#07-18). Typing a unit or a stack lists its sales across the whole span. Profit is the sale price less the seller's own purchase price as the caveats pair them, before stamp duties, fees and loan interest; the gain a year is compounded and shown from one year held. The trend line is the median from two sales up per month, quarter or half-year, the district line from ten. 10Y appears once the dataset runs that far back.
- Rent: aggregates of URA rental contracts, Sep 2025 – Aug 2026, for unit types with three contracts or more; the contract list under the table carries every letting on file, including those with no bedroom count, and URA publishes no unit number for a letting. "Most rents" is the middle half of contracts, shown from five up. Gross yield is a year of the median rent over the median resale price of the same unit type (12 months to October 2026, two sales or more), before maintenance fees, property tax, agent fees, vacancy and mortgage interest.
- By stack: resales from 2022 to Oct 2026, medians per stack. A stack is the last two digits of the unit number, so #05-37 and #08-37 are both stack 37. Stacks with one sale (43 here) are left out, and prices moved over the period, so read a gap between two stacks as a lead to check, not a rule.
- Factor bars: the black mark on each bar is the district median.
- Score: seven weighted factors. Methodology published.
What the score cannot tell you
- RPS scores the project, not a unit. Floor, stack, facing, renovation and the asking price are outside the score. In the 12 months to October 2026, the 30 resale caveats at Caribbean @ Keppel Bay ranged from $1,185 psf to $2,170 psf: that spread is unit-level variation the score cannot see.
- Historical Performance is a percentile among projects of similar vintage (completed around 2004, within a year or so, widened when the cohort is small). A high score is strong for its age group, not against the whole market.
- MRT Proximity is the straight-line distance to Telok Blangah MRT (CC28) (660m). The walking route is usually longer, and bus links are not scored.
- No primary school falls within the 1 km straight-line radius the Primary School Effect uses, so none counts toward the score; a school just outside it would not appear.
- Scores updated October 2026; transactions to October 2026. Nothing on this page is a valuation or advice on a specific unit.
- Facing decides a unit's morning or afternoon sun, and it varies stack by stack. See the sun path at Caribbean @ Keppel Bay for any facing, date and time → The hours count direction only; the 3D map draws the shadows of the blocks around it.