Insights
Private Prices Rose 1.4%. The 30% Volume Collapse in the Same Release Is a Partial Quarter.
URA and HDB published third-quarter flash estimates this morning pointing opposite ways: private prices to a record 222.5, public prices down for a fourth straight quarter. The 30% volume drop printed alongside counts two and a half months against three.
By TRIBE Editorial · 1 October 2026 · 8 min read
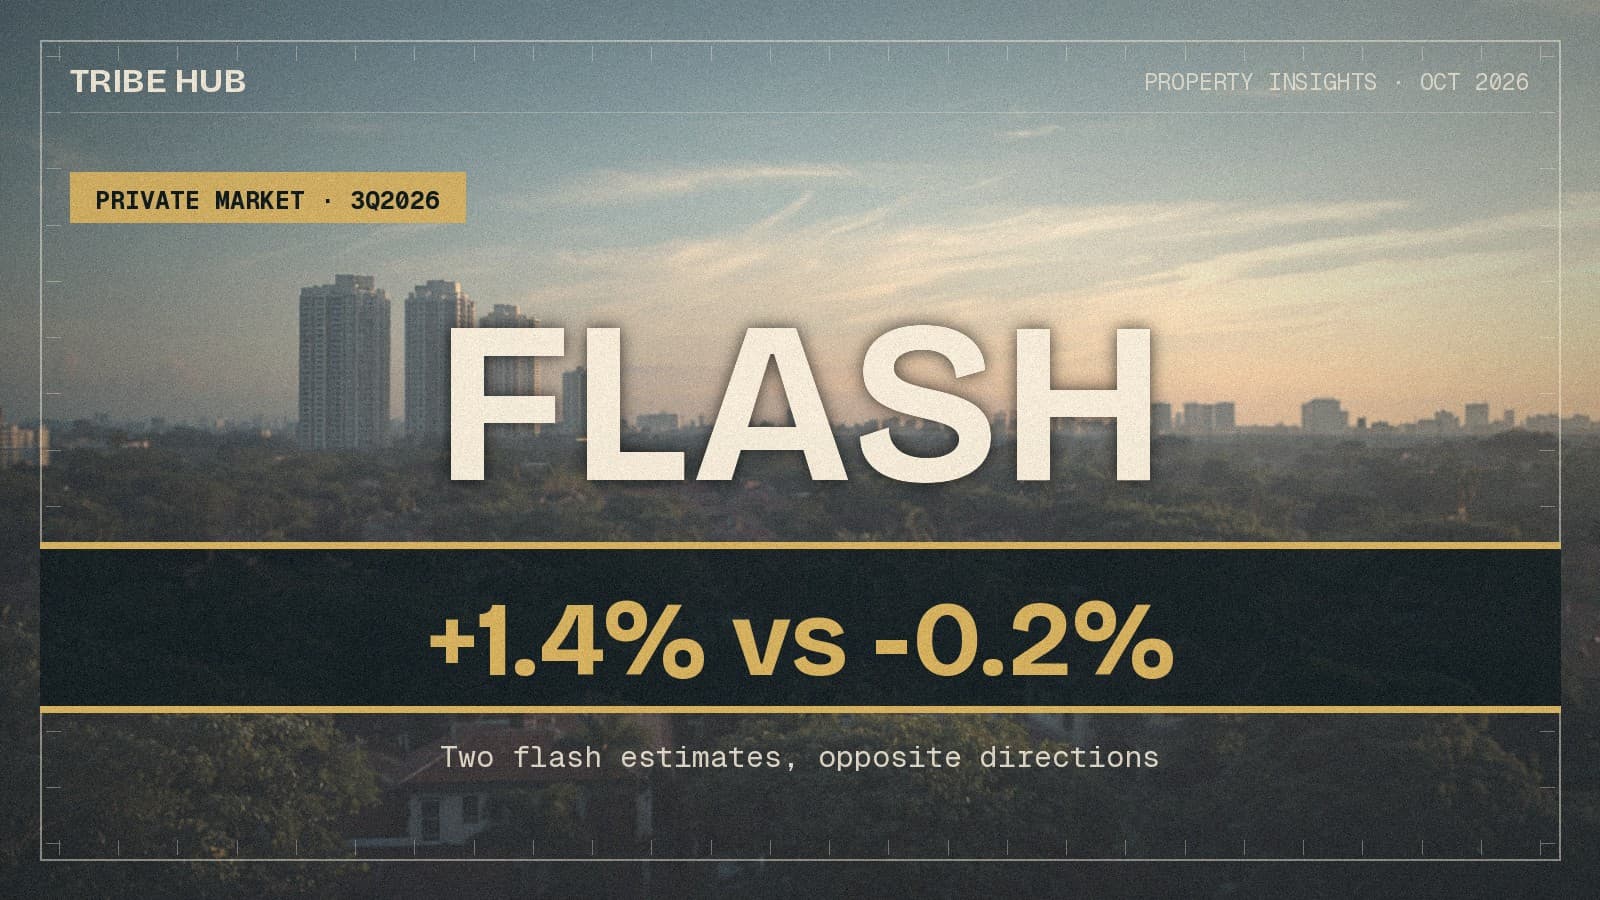
Two flash estimates landed within hours of each other this morning. URA's private residential price index rose 1.4% in the third quarter, its fastest quarter in two years and a new record of 222.5. HDB's resale index fell 0.2% to 202.4, a fourth consecutive decline from its peak.
The third number in URA's release — sale volume "down by about 30%" — is the one to handle carefully. It counts an unfinished quarter against a finished one, and last quarter the same construction pointed the wrong way entirely.
The 30% is measuring two different lengths of quarter
URA's release says it plainly, in a parenthesis most coverage will drop: "Sale transaction volume (up to mid-September) totalled 4,296 in 3rd Quarter 2026, compared to 6,148 in 2nd Quarter 2026."
The 4,296 is a part-quarter count. The 6,148 is a complete one. Dividing the first by the second produces -30.1%, and that number is in the release, but it is not a measurement of how much the market slowed.
Last quarter's release is the receipt. On 1 July, URA's 2Q flash reported: "Sale transaction volume (up to mid-June) totalled 5,420 in 2nd Quarter 2026, compared to 5,413 in 1st Quarter 2026." Read at face value that is a flat market, +0.1%.
When the full 2Q statistics were published on 24 July, the quarter's actual total was 2,141 developer sales plus 3,813 resales plus 194 sub-sales — 6,148 units. Against 1Q's final 5,413, the real answer was +13.6%.
| 2Q2026 | 3Q2026 | |
|---|---|---|
| Flash count (part-quarter) | 5,420 | 4,296 |
| Final count | 6,148 | published 23 Oct |
| Share captured by the flash | 88.2% | — |
| Headline comparison in the release | "+0.1%" (flat) | "about -30%" |
| What the final showed | +13.6% | — |
Last quarter the flash captured 88.2% of what the quarter eventually recorded. The shortfall is mechanical: caveats are lodged after a deal is signed, so the back end of any quarter is always thin on flash day.
Apply that same capture rate to this morning's 4,296 and the third quarter is tracking toward roughly 4,870 units. Against 2Q's 6,148, that is about -21%. Comparing the two part-quarter counts directly — 4,296 against 5,420, like for like — gives the same answer: -20.7%.
So volume did fall, and it fell hard. A fifth of the market is a real contraction, not a rounding artefact. But the headline figure overstates it by about half again, and the correction is available from URA's own numbers before the final release on 23 October.
What the price number actually says
The 1.4% is the strongest quarterly gain since 4Q2024 and it is not broadly based.
| 2Q2026 | 3Q2026 flash | Change | |
|---|---|---|---|
| All residential | 219.4 | 222.5 | +1.4% |
| Landed | 258.4 | 265.6 | +2.8% |
| Non-landed | 210.6 | 212.5 | +0.9% |
| — Core Central (CCR) | 161.5 | 161.3 | -0.1% |
| — Rest of Central (RCR) | 226.2 | 226.7 | +0.2% |
| — Outside Central (OCR) | 271.1 | 277.1 | +2.2% |
Landed housing did roughly twice the work of everything else, and within the non-landed market a single segment carried it. OCR rose 2.2%; RCR moved 0.2%, which is noise; CCR fell. The prime districts are the only segment of the private market that got cheaper this quarter.
That is the same shape the launch market has been showing. Amberwood at Holland sold 11% of its units on launch weekend in late September at $3,019 psf — the weakest CCR opening in a year — while suburban launches have cleared. A 2.2% OCR quarter on roughly a fifth less volume says the buyers who are still transacting are concentrated outside the centre.
Treat the segment splits as the softest numbers in the release. URA revised every one of them between the 2Q flash and the 2Q final: landed 2.6% to 2.5%, CCR 2.0% to 1.8%, RCR -1.4% to -1.2%, OCR -0.2% to -0.1%. The overall figure held at 0.5%. The headline tends to survive; the breakdown moves.
The public market is doing the exact opposite
Set the two releases side by side and they are mirror images.
| Private (URA) | Public (HDB) | |
|---|---|---|
| 3Q2026 index | 222.5 | 202.4 |
| Quarterly price change | +1.4% | -0.2% |
| Direction of volume | down ~21% | up 19.9% |
| 3Q2026 transactions | ~4,870 (est.) | 7,417 registered |
HDB's index has now fallen in every quarter since 3Q2025, from 203.7 to 202.4 — a cumulative 0.64% over a year. Over the same four quarters registered resale volume ran to 7,417 flats in 3Q2026, up 19.9% on the previous quarter and the fourth-heaviest quarter of the 39 since 2017.
One market is repricing upward on thinner trade. The other is clearing heavy volume at flat-to-slightly-lower prices. Both are functioning; they are simply at different points in the same cycle.
The spread between the indices is the number worth keeping. Both are set to 100 in 1Q2009. Private is now at 222.5, public at 202.4 — a gap of 20.1 index points, against 11.4 points a year ago. The two markets have pulled 8.7 points apart in four quarters, which is the fastest divergence in the post-2009 series.
For anyone planning to move from a flat to a condominium, that gap is the whole story, and it has moved against them all year.
What to do with this
If you are selling private property, the index is at a record and your segment probably isn't. Check which of the three regions you are in before pricing to the 1.4%. If you are in the CCR, the number that applies to you is -0.1%.
If you are buying private, falling volume with rising prices usually means fewer listings rather than more eager buyers. That is a thinner market to choose from, not a hotter one. It is also the condition under which a single motivated seller sets a whole block's comparable, so the spread between units is likely wider than usual.
If you are upgrading from HDB to private, the arithmetic got worse again this quarter — your flat is in an index that fell while the thing you are buying rose. Nothing in a 1.4% quarter justifies rushing, but a 20.1-point gap that widened 8.7 points in a year is a genuine trend, not noise.
If you are reading the volume headline anywhere today, halve the alarm. The market contracted by about a fifth, not by a third, and the final count on 23 October will say so.
Method
URA price index figures from the flash estimate for 3rd Quarter 2026, released 1 October 2026, and its Annex A table of index values. Prior-quarter figures from the 2Q2026 flash estimate of 1 July 2026 and the 2Q2026 full statistics of 24 July 2026. The 2Q and 1Q final transaction totals are the sums of developer sales, resale and sub-sale transactions as published in that release (2,141 + 3,813 + 194 = 6,148 for 2Q; 2,013 + 3,225 + 175 = 5,413 for 1Q), excluding executive condominiums. The long-run index series is URA's, retrieved from SingStat Table Builder M212261, 1Q1975 to 2Q2026, with the 3Q2026 flash appended.
HDB index values from the Resale Price Index table, 1Q1990 to 3Q2026 flash estimate, retrieved 1 October 2026. HDB transaction counts computed from all 241,710 registered resale records on data.gov.sg, January 2017 to September 2026, retrieved 1 October 2026. Those are registration dates, which trail the date a deal is agreed, and the file continues to receive records after retrieval — the same dataset returned 7,304 for 3Q2026 yesterday and 7,417 today, so treat that figure as a floor.
Both indices are quality-adjusted and share a 1Q2009 = 100 base, which is what makes the 20.1-point spread a like-for-like comparison. Flash estimates are preliminary; URA publishes full third-quarter statistics on 23 October 2026. The ~4,870-unit projection is this morning's 4,296 divided by last quarter's 88.2% flash capture rate, and is an arithmetic projection from one quarter of precedent, not a forecast.
Check how your condo scores
2,357 condos independently scored across 7 weighted factors. No registration required.
Score my resale →Prefer a personal read on your situation? Arrange a consultation →Keep reading
1 October 2026Private Property Market
Four Analysts Priced the Same Siglap Plot. Their Forecasts Differ by $613,000 a Home.
29 September 2026Private Property Market
Newer Condos Score Higher. Almost None of It Is Returns.
28 September 2026Private Property Market
The Cheapest Prime Launch of 2026 Sold 11%. It Has No Two-Bedroom.

TRIBE Editorial · Reviewed by Silas Tan
Co-Founder, TRIBE · District Director, Huttons Asia · Ex-Mortgage Banker (AVP) · >1,000 families advised · CEA R000303I
How TRIBE scores and checks its analysis
Spotted an error, or a figure that has moved since publication? Tell us and we will correct it.
This article is for informational purposes only and does not constitute financial or investment advice.