Insights
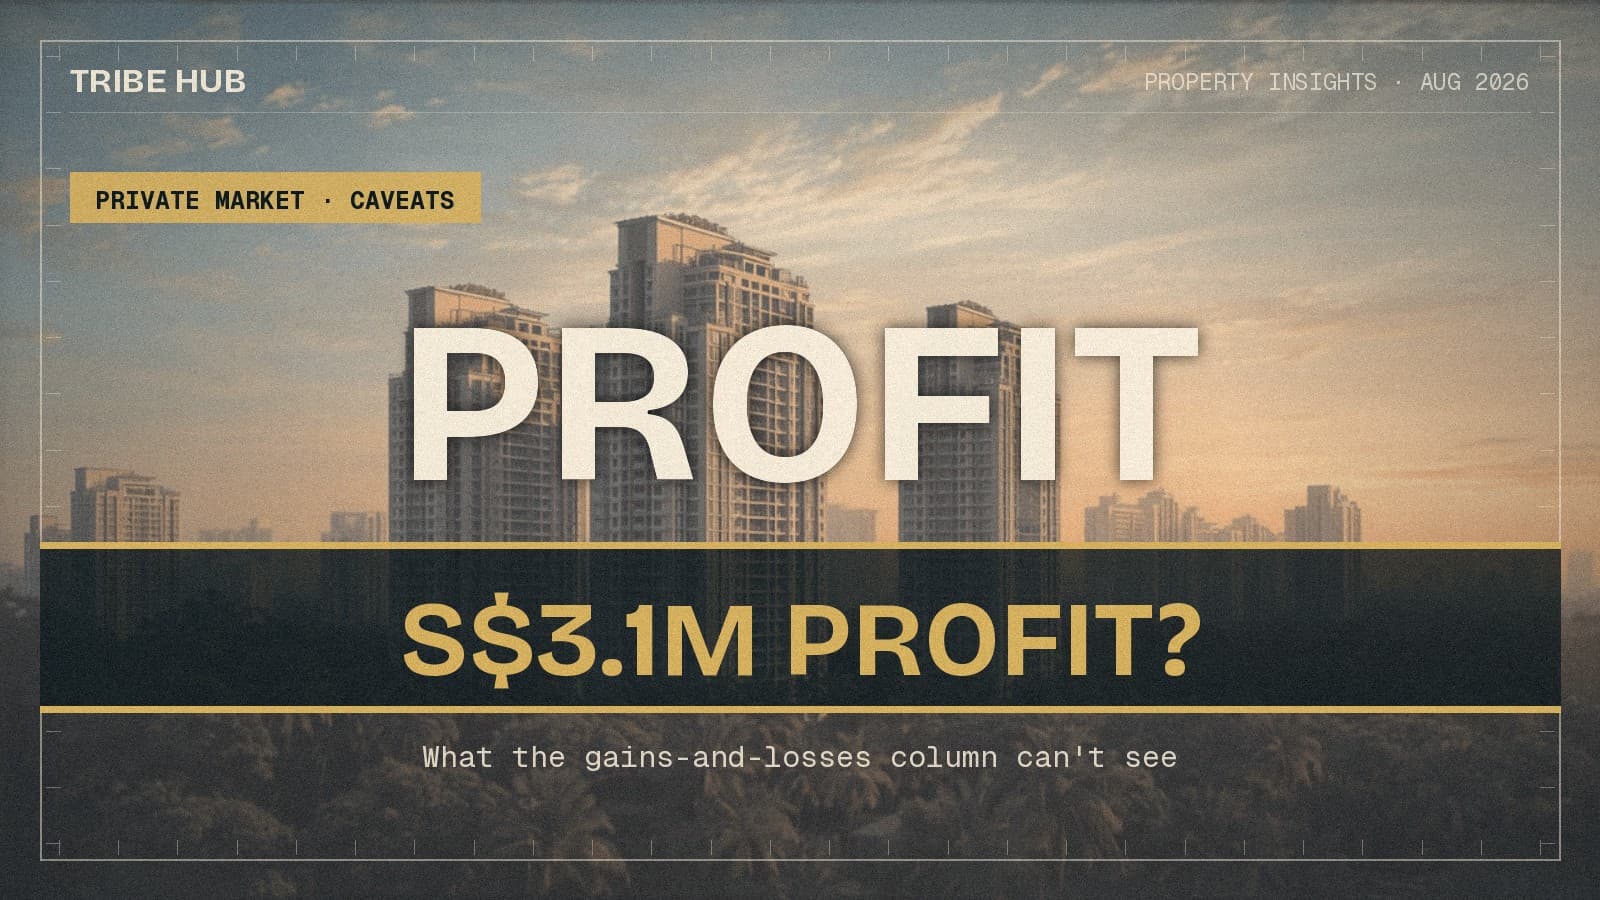
A S$3.1 Million 'Profit' Is a Price Gap, Not a Payout
This week's most profitable resale — S$3.1 million on a Palm Spring three-bedder held 23 years — is a subtraction between two caveats. Model the stamp duty, commission, interest and fees and a fifth of it goes away. Model the leverage and the return improves.
By TRIBE Editorial · 28 August 2026 · 6 min read
The most profitable condo resale of the week, per EdgeProp's caveat rundown: a 1,884 sq ft three-bedder at Palm Spring, a freehold in District 10, bought in 2003 for S$1.15 million and sold on 14 August for S$4.25 million. Headline profit: S$3.1 million. The steepest loss: a two-bedder at Skyline @ Orchard Boulevard, bought from the developer in 2010 for S$6.58 million and resold for S$4.8 million — S$1.78 million down, the development's first unprofitable resale on record.
Both numbers are correct, and neither is what the seller banked. A caveat-pair "profit" is one subtraction: sale price minus purchase price. Everything the ownership actually cost — and everything it paid back — is invisible to it. The gains-and-losses column is the most-read property table in Singapore, so it is worth working one entry end to end.
The bridge from S$3.1 million
Here is the same transaction with the knowable costs restored. Two are exact, two are modelled with stated assumptions:
| Item | Amount | Basis |
|---|---|---|
| Headline caveat profit | S$3,100,000 | S$4,250,000 − S$1,150,000 |
| Buyer's stamp duty (2003) | −S$29,100 | pre-2018 BSD scale: 1% / 2% / 3% (IRAS) |
| Sale commission, 2% + 9% GST | −S$92,650 | market-typical seller's fee on S$4.25m |
| Loan interest, modelled | −S$402,625 | 80% loan (S$920,000), 30-year, 2.75% average |
| Maintenance fees, modelled | −S$110,000 | S$400/month × 275 months |
| Profit net of the above | ≈S$2,466,000 | 79.5% of the headline |
About S$634,000 — a fifth of the headline — was consumed by the four items a caveat pair cannot see. The interest line is the big one, and it is genuinely a model, not a record: we assume the buyer borrowed 80% in 2003 and serviced a 30-year loan at an average of 2.75% throughout, never refinancing or redeeming early. Real mortgages wander. But no plausible financing path takes the true figure to zero — only an all-cash purchase does, and that swaps the interest line for 23 years of forgone return on S$1.15 million, which is larger.
Not modelled at all: legal fees on both ends (roughly S$7,000–8,000 across the two transactions), property tax, insurance, and any renovation. Nor the offsets — if the unit was tenanted for even part of 23 years, a District 10 three-bedder's rent would swamp every cost line above, and the caveat is equally blind to that. The column strips out both the bleeding and the earning. It is a price series, not a P&L.
The number that improves under scrutiny
Here is the part the headline gets backwards. EdgeProp annualises the profit at 5.9% a year — S$1.15 million growing to S$4.25 million over 23 years. That is the property's return. It is not the seller's, because the seller never put S$1.15 million in.
Model the actual cash flows — S$259,000 down in 2003 (20% plus stamp duty and legal), then S$4,156 a month in mortgage and maintenance, then the sale proceeds net of the outstanding S$290,000 balance and selling costs in 2026 — and the internal rate of return on money actually deployed comes to about 6.8% a year. Costs shaved a fifth off the profit; leverage more than gave it back. A financed property that appreciates is a larger bet on a smaller stake, which is the entire reason the annualised-on-price figure understates well-timed purchases.
The same arithmetic is merciless in reverse. The Skyline @ Orchard Boulevard seller's S$1.78 million headline loss annualises to a gentle-sounding −1.9% a year on price. But add the S$192,000 of stamp duty paid in 2010 and roughly S$104,600 of commission to sell, and the all-in shortfall passes S$2.08 million before a single year's interest — on a unit bought at S$3,776 psf and surrendered at S$2,753 psf. If that purchase was financed, the equity outcome is dramatically worse than −1.9% a year; leverage amplifies whatever sign the price move carries. One caveat cannot tell you which it was.
Reading the column without being misled
Four habits make the weekly table useful rather than seductive:
Annualise before admiring. The middle entry of this week's list — a One Amber four-bedder sold at a S$2.06 million gain over 17 years — works out to 4.3% a year. Solid, unspectacular, and in some stretches beaten by doing nothing exotic at all. Twenty-three-year holds turn modest compounding into seven-figure headlines; that is arithmetic, not alpha.
Deduct the round trip. In the Palm Spring case, stamp duty, sale commission and maintenance alone came to 5.5% of the sale price — before interest. As a fast rule, a buy-and-sell round trip in Singapore costs roughly 5–6% of the exit price for an owner-occupier on today's BSD scale — more if seller's stamp duty is in play, which it was not here. A "profit" smaller than that band is a loss wearing makeup.
Ask what the caveat can't see. Renovation on the way in, tenancy along the way, CPF accrued interest to refund at completion — none of it appears. Two identical caveat pairs can hide opposite lived outcomes.
Remember the survivorship. The column ranks the extremes of one week. The same report notes Palm Spring's four other resales this year cleared S$1.36 million to S$2.38 million — and that Skyline's loss was the first in the project's 16-year caveat record. Extremes are what the format selects for; they are not the distribution. The middle of the market looks like the index, not like either end of the table.
Sources: transaction details from EdgeProp Singapore's gains-and-losses report, 27 August 2026 (caveats for the week of 11–18 August). Historical BSD scale per IRAS (rates for property acquired before 20 February 2018). Cost bridge assumptions as stated in the table: 80% loan-to-value at a 2.75% average rate over a 30-year schedule with no refinancing, S$400/month maintenance, 2% sale commission plus 9% GST; interest, maintenance and the cash-on-cash IRR are computed models, not records of the actual owner's financing, and the true figures will differ with the owner's loan history, tenancy and renovation. This article is general information, not financial advice.
Check how your condo scores
2,352 condos independently scored across 7 weighted factors. No registration required.
Score my resale →Prefer a personal read on your situation? Arrange a consultation →Keep reading
12 October 2026Private Property Market
Five Foreigners Were Approved to Buy a Good Class Bungalow in a Decade. None Since 2021.

11 October 2026Private Property Market
One S$70 Million Deal Decides Whether the Shophouse Quarter Was Up or Down
10 October 2026Private Property Market
A Record S$42.4 Billion. A Quarter of It Was the Government Selling Land.
Next step

TRIBE Editorial · Reviewed by Silas Tan
Co-Founder, TRIBE · District Director, Huttons Asia · Ex-Mortgage Banker (AVP) · >1,000 families advised · CEA R000303I
How TRIBE scores and checks its analysis
Spotted an error, or a figure that has moved since publication? Tell us and we will correct it.
This article is for informational purposes only and does not constitute financial or investment advice.