Insights
Prices Up 0.9%, Volumes Down 19% — Soft Landing or Buyer-Seller Stalemate?
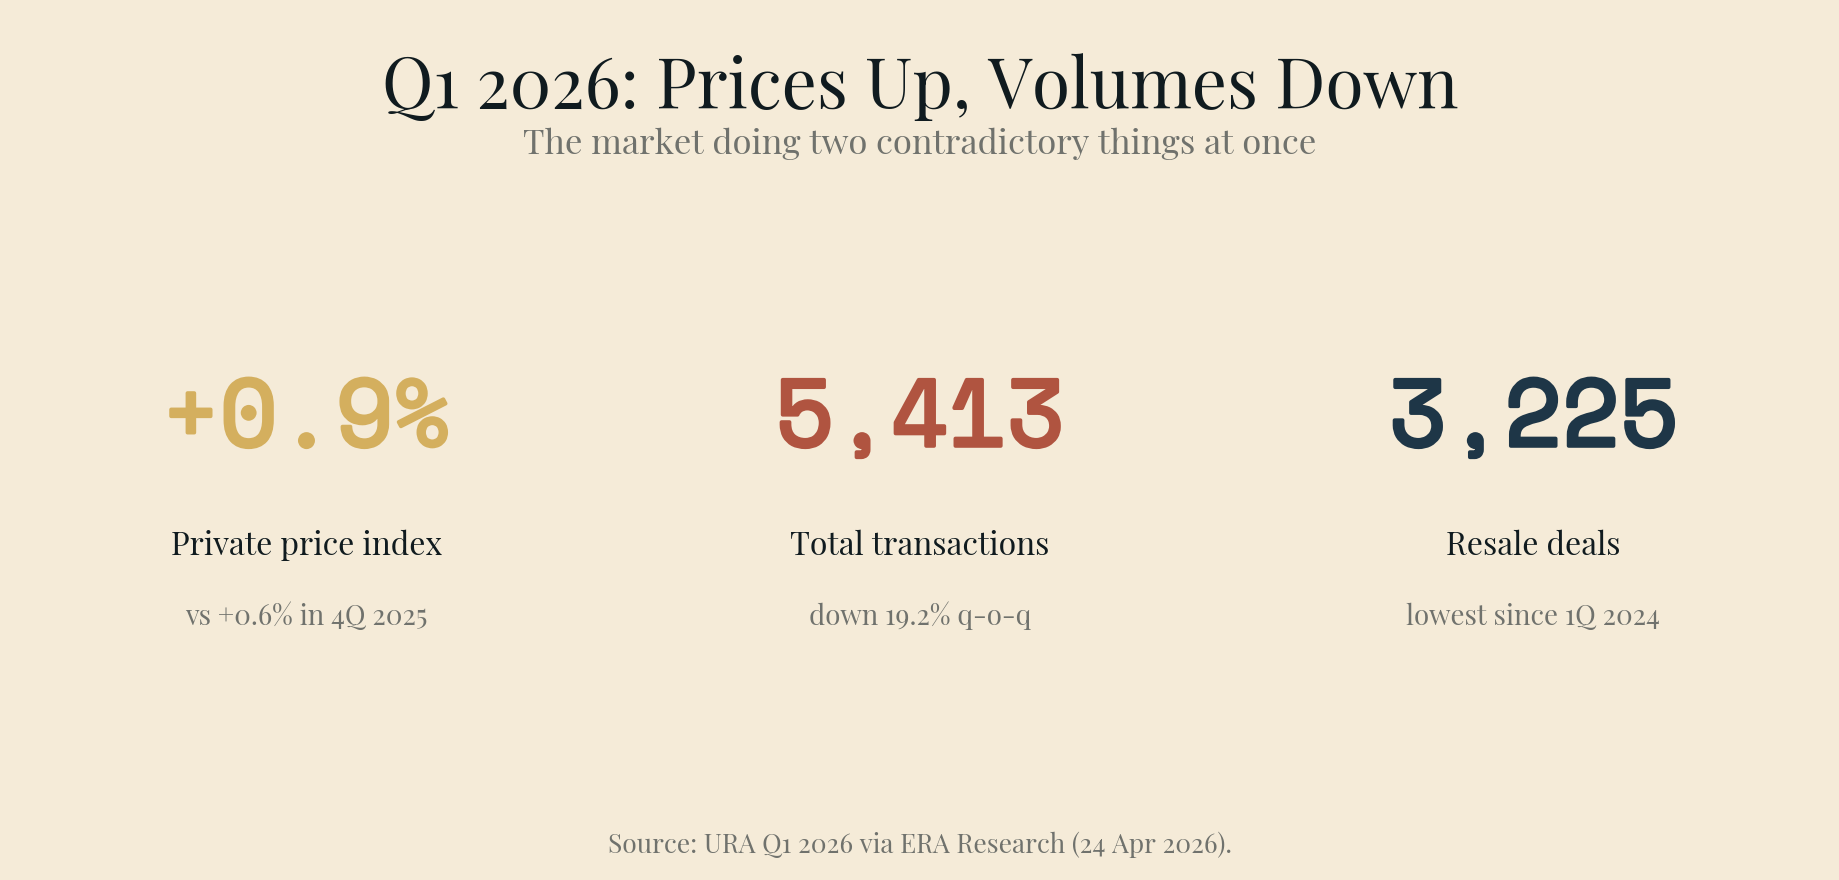
URA's Q1 2026 numbers point in two directions at once: private home prices rose 0.9% while transactions fell 19.2% to 5,413 — with resale volumes at their lowest since early 2024. Here's how both can be true, and what it means if you're waiting.
By TRIBE Editorial · 13 June 2026 · 6 min read
The Q1 2026 URA statistics, released on 24 April, describe a market doing two contradictory things at once. The private residential price index rose 0.9% quarter-on-quarter — a faster clip than Q4 2025's 0.6%. Transaction volumes went the other way: 5,413 private homes changed hands, down 19.2% from the previous quarter, with resale deals falling to their lowest level since the first quarter of 2024. Prices say the market is healthy; volumes say buyers and sellers have stopped agreeing. Both numbers are real. The question is which one is telling you the truth.
What Actually Moved
Break the 5,413 transactions apart and the slowdown is not evenly spread.
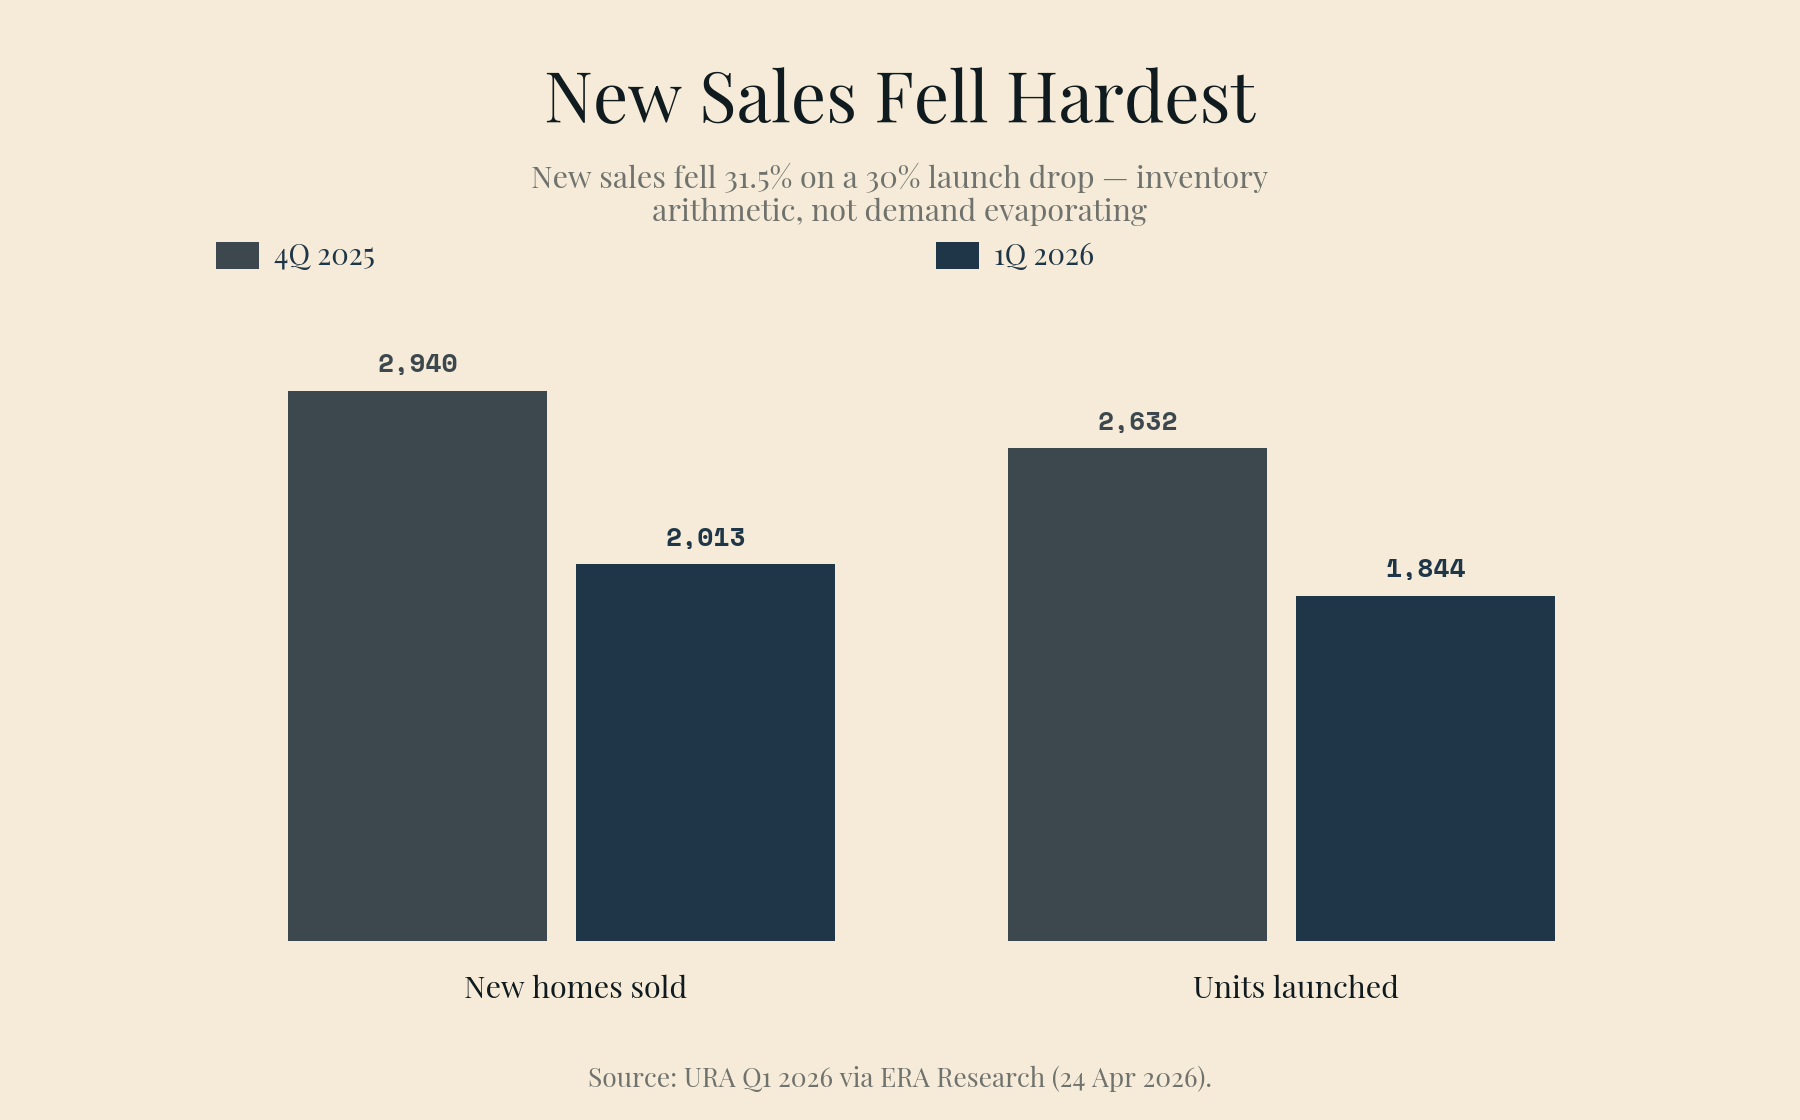
New sales fell hardest — and most explicably. Developers sold 2,013 new homes, down 31.5% from 2,940 in Q4 2025. But they also launched far less: 1,844 units came to market against 2,632 the quarter before, after a bumper second half of 2025 that pulled demand forward. Lunar New Year landed in February. The projects that did launch sold well — Pinery Residences in Tampines and the Rivelle Tampines EC both cleared roughly 90% or more of launch-weekend stock. A 31.5% sales drop on a 30% launch drop is not demand evaporating; it's inventory arithmetic.
The resale market is where the standoff lives. Resale transactions fell 8.6% to 3,225 — the weakest quarter in two years. Sub-sales slid to 175. And unlike new sales, there's no launch-calendar excuse: this is sellers asking yesterday's momentum prices and buyers declining to pay them, deal by deal, until volume goes quiet.
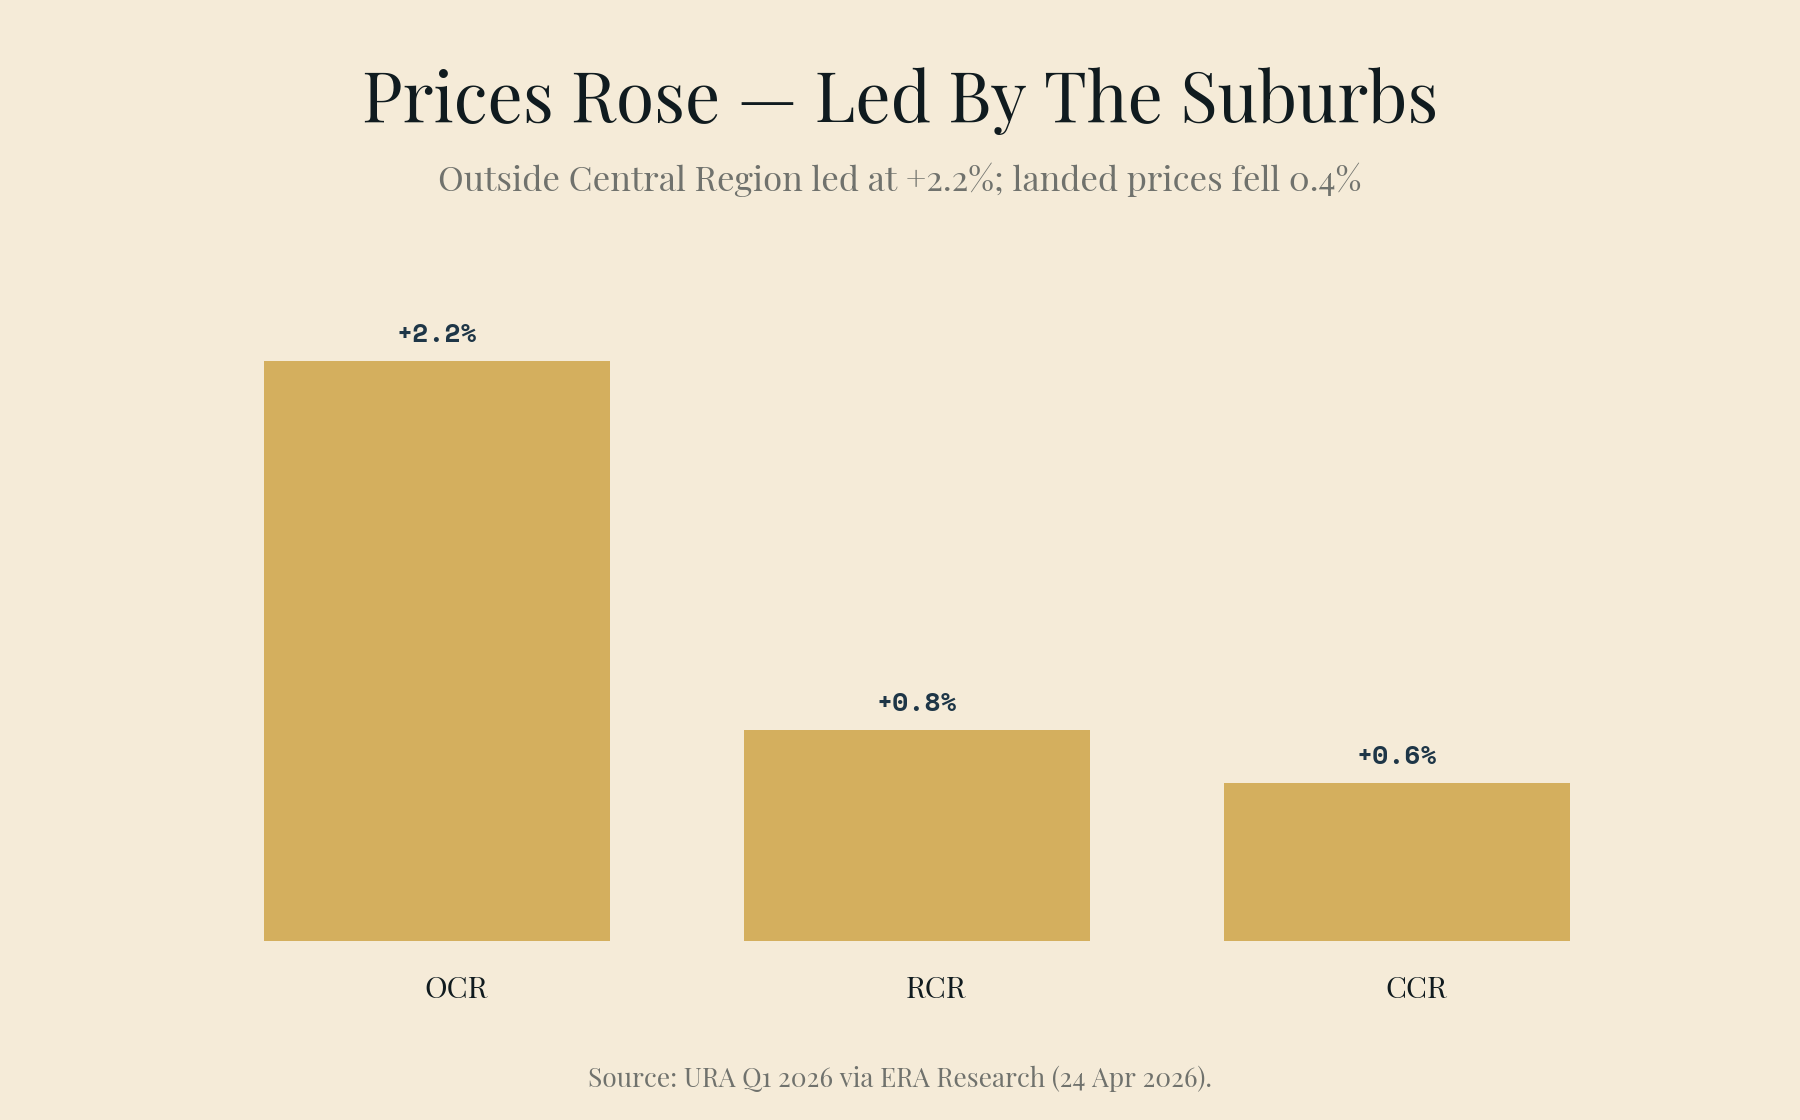
Prices still rose — led by the suburbs. Non-landed prices in the Outside Central Region climbed 2.2%, against 0.8% in the Rest of Central Region and 0.6% in the Core Central Region. Landed prices actually fell 0.4%. The index was effectively pulled up by OCR launches transacting at benchmark pricing while everything else trod water.
How Prices Rise While Volumes Fall
A price index measures the deals that happen. When the deals that happen are concentrated in well-received new launches selling at developer pricing — and the contested resale market simply transacts less — the index drifts up even as the broader market goes quiet. That's not a flaw in the index; it's a description of who blinked. In Q1 2026, almost nobody did.
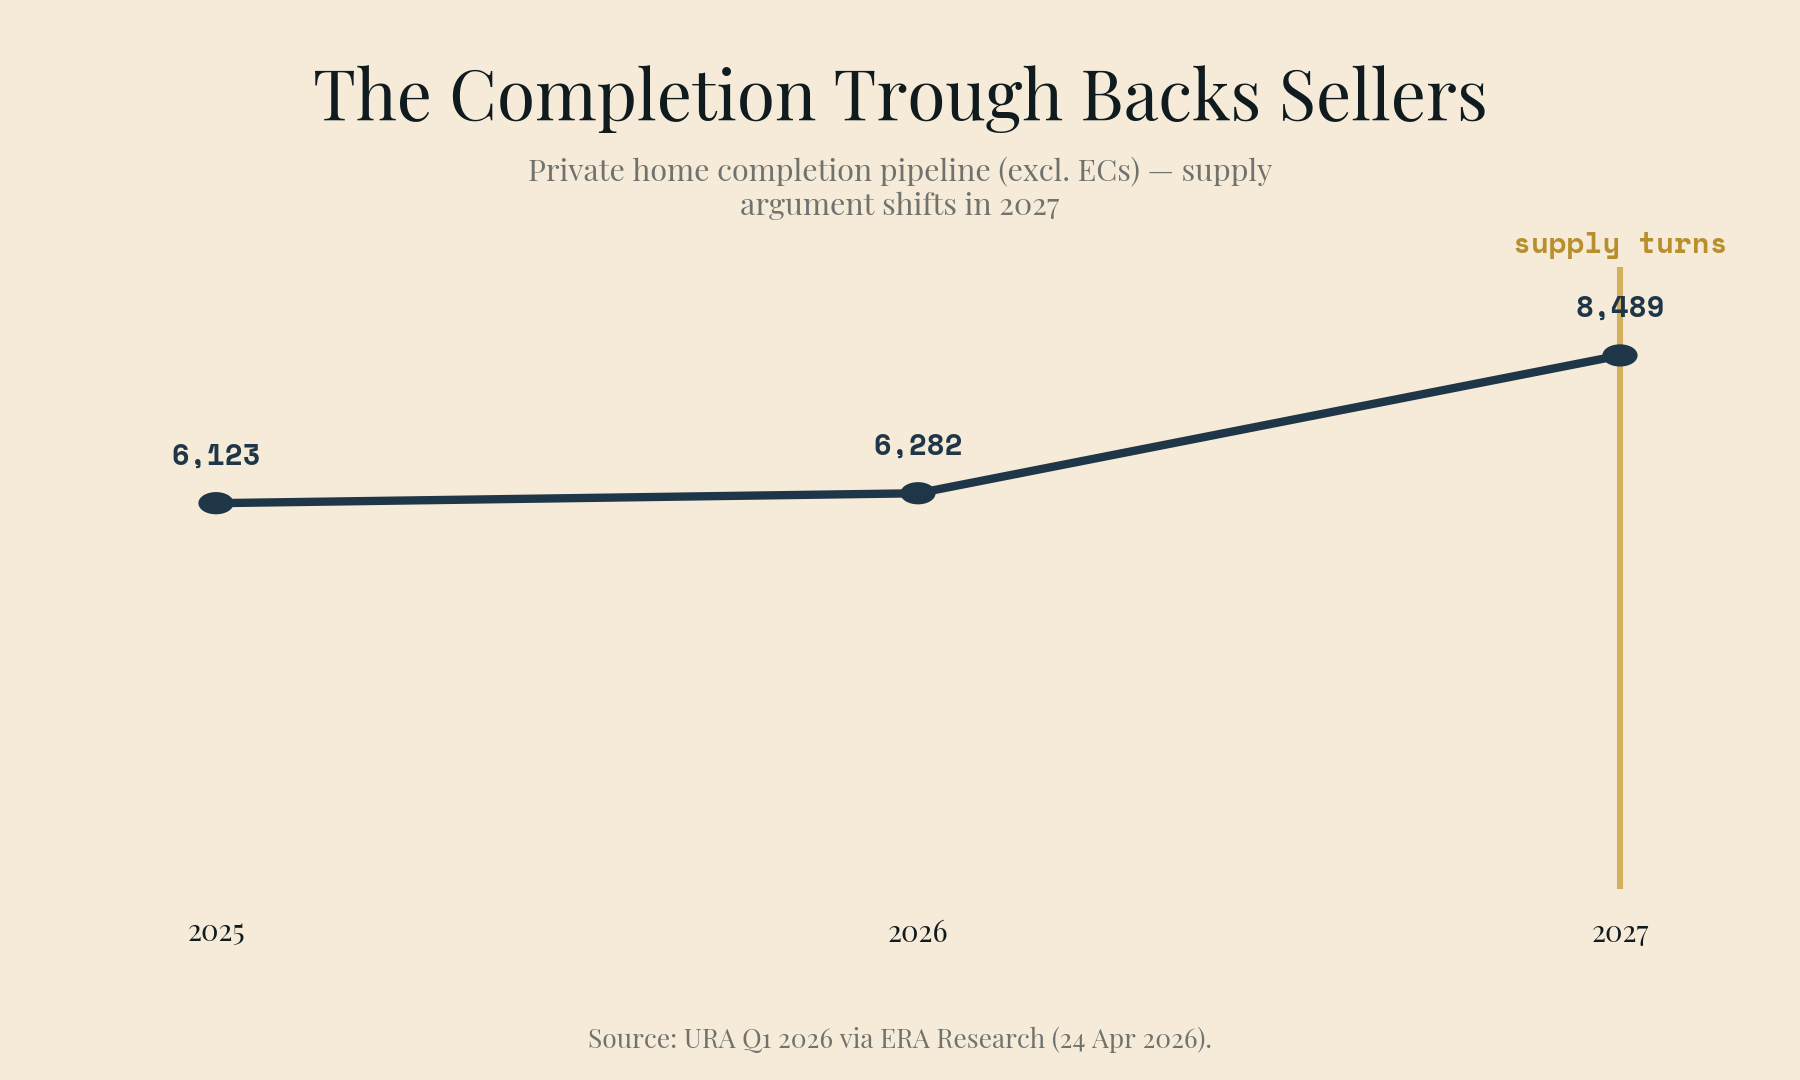
Two structural facts explain why sellers can afford to hold. First, completions have collapsed: just 911 private homes (excluding ECs) completed in Q1, and the full-year 2026 pipeline is about 6,282 units, barely above 2025's 6,123 — both thin years by historical standards. Fewer keys handed over means fewer owners forced to choose between two mortgages, which means fewer motivated sellers. Second, the unsold pipeline is not pressuring anyone: 16,219 unsold units (excluding ECs) sounds large, but it fell 7.5% during the quarter on the back of strong launch take-up.
On the other side of the ledger, the government is leaning against scarcity: the 1H 2026 Government Land Sales confirmed list carries 4,575 private residential units — roughly 50% above the average half-yearly confirmed supply. That's tomorrow's inventory, arriving as launches from 2027 onward.
Soft Landing or Stalemate? The Honest Answer Is Both
On prices, the soft-landing case is straightforward: +0.9% follows +0.6%, annualising to roughly 3% — the kind of year the market's own forecasters are projecting (ERA's 2026 call is 3–5%). No spike, no slide, supported by owner-occupier demand and thin completions.
On volumes, "stalemate" is the more accurate word — but it's a stalemate with an asymmetry. Sellers are holding out backed by low holding costs and scarce supply. Buyers are holding out backed by... the hope that someone else blinks first. As long as 18 more private projects and five ECs are scheduled to launch through 2026, developers keep setting the marginal price — and each launch that clears at benchmark pricing quietly re-anchors what resale sellers think their unit is worth. A waiting buyer is not actually frozen out; they are watching the reference price ratchet upward at about 1% a quarter while they wait.
What This Means in Practice
If you're a buyer waiting for capitulation: the data shows no mechanism for it. Resale supply is constrained by the completion trough through at least 2026 (2027's pipeline rises to 8,489 units — that's the first date the supply argument shifts). Waiting costs roughly the index's quarterly grind; make sure whatever you're waiting for has a date attached.
If you're a resale seller: the 3,225 number is the warning. Pricing at last quarter's launch benchmarks works in theory and sits unsold in practice — buyers in this market are, in ERA's phrasing, "more deliberate." Well-located units priced to the last transacted comparable still move; aspirational listings are why volume is at a two-year low.
If you're an upgrader: the OCR's +2.2% is your market — both the asset you're selling into and the one you're buying. The two legs of the trade are inflating together, which makes timing less important than the gap between them. Run the math on the spread, not the headline.
We'll be watching Q2's flash estimate (due early July) for whether the resale freeze starts thawing as the post-CNY launch calendar fills out. Three major launches are slated for the quarter; their take-up rates will tell you whether Q1 was a seasonal lull or the start of a longer standoff.
Sources: URA Q1 2026 real estate statistics, via ERA Research (24 Apr 2026); 99.co analysis.
Silas Tan is a District Director at Huttons Asia and co-founder of TRIBE. He built the Resale Project Scorecard (RPS) using 236,000+ URA REALIS transactions. This article is for informational purposes and does not constitute financial or investment advice. CEA Registration R000303I.
Check how your condo scores
2,357 condos independently scored across 7 weighted factors. No registration required.
Score my resale →Prefer a personal read on your situation? Arrange a consultation →Keep reading

28 July 2026Private Property Market
The 15-Month Wait-Out Period Is Gone. Here's Who It Doesn't Apply To.
27 July 2026Private Property Market
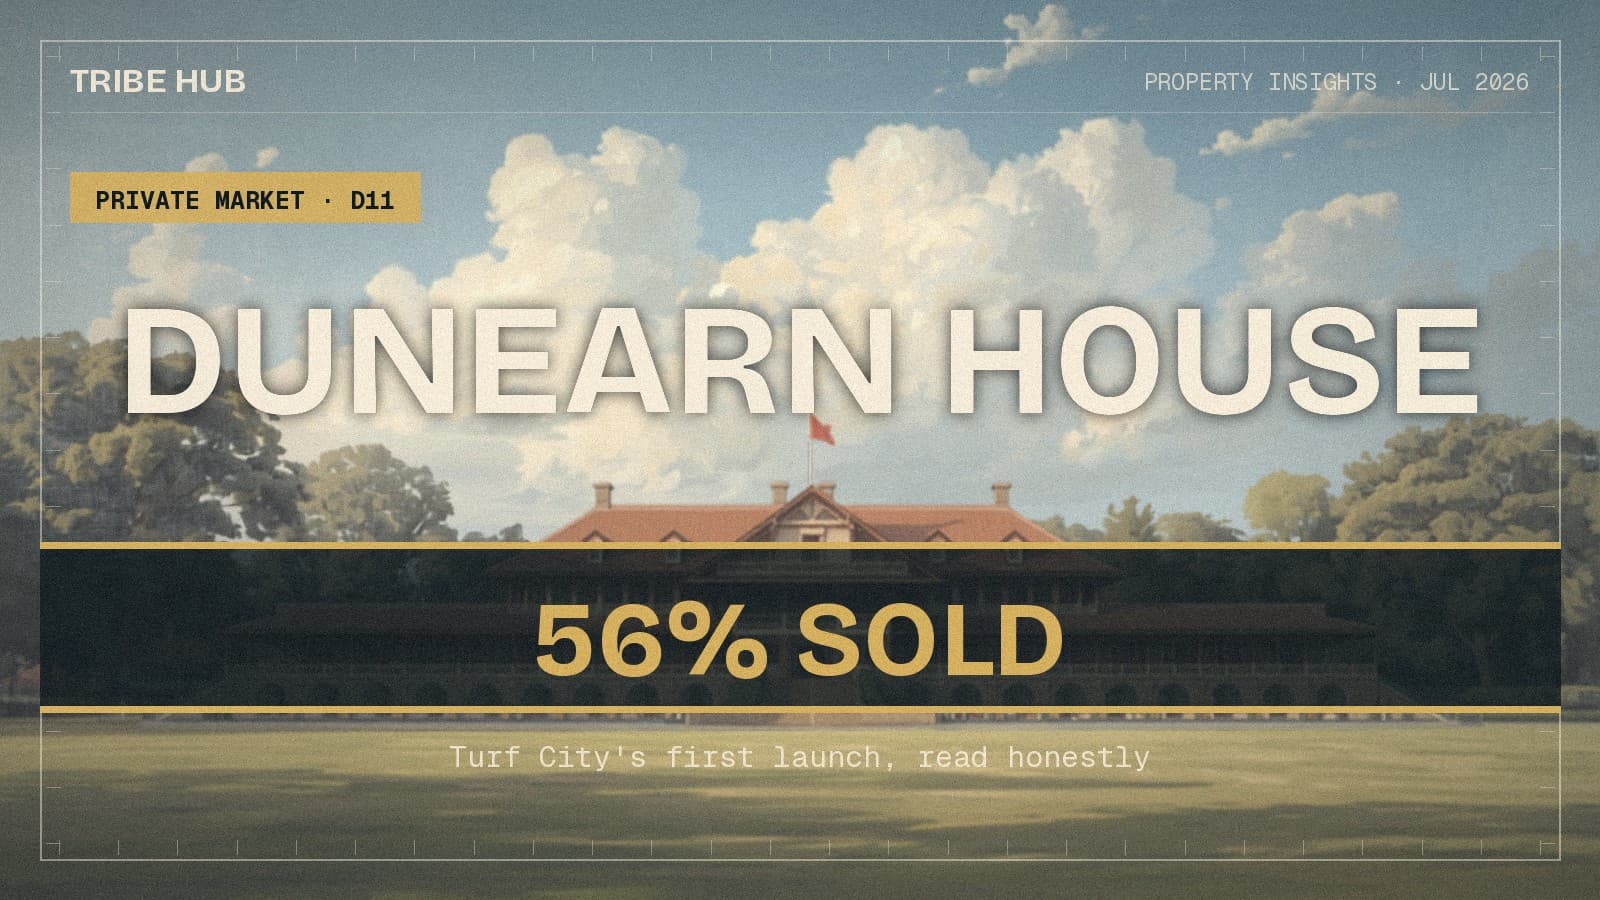
Why Dunearn House Sold 56% in a Weekend — and What the Other 44% Tells You

26 July 2026Private Property Market
How to Read a Land Bid: From PSF PPR to the Price You'll Pay

TRIBE Editorial · Reviewed by Silas Tan
Co-Founder, TRIBE · District Director, Huttons Asia · Ex-Mortgage Banker (AVP) · >1,000 families advised · CEA R000303I
This article is for informational purposes only and does not constitute financial or investment advice.